Crypto
Pump.fun vs. LetsBonk: Tracking Market Dominance
Pump.fun reclaimed dominance in August 2025 with 73.6% market share and $13.5M weekly revenue, as LetsBonk’s July hype unraveled—sliding to just 15.3% share and under $30K daily.
Quick Overview
- LetsBonk surged in July 2025 to 64% market share and $7.9M revenue, briefly overtaking Pump.fun.
- By August, activity collapsed; Pump.fun rebounded to 73.6% share, $13.48M weekly revenue, and 1.37M traders.
- Pump.fun’s steady 1% fee model drove $800M+ lifetime revenue, while LetsBonk’s BONK-linked incentives proved unsustainable.
Market Flip in August 2025
Phase 1: LetsBonk’s July Rise
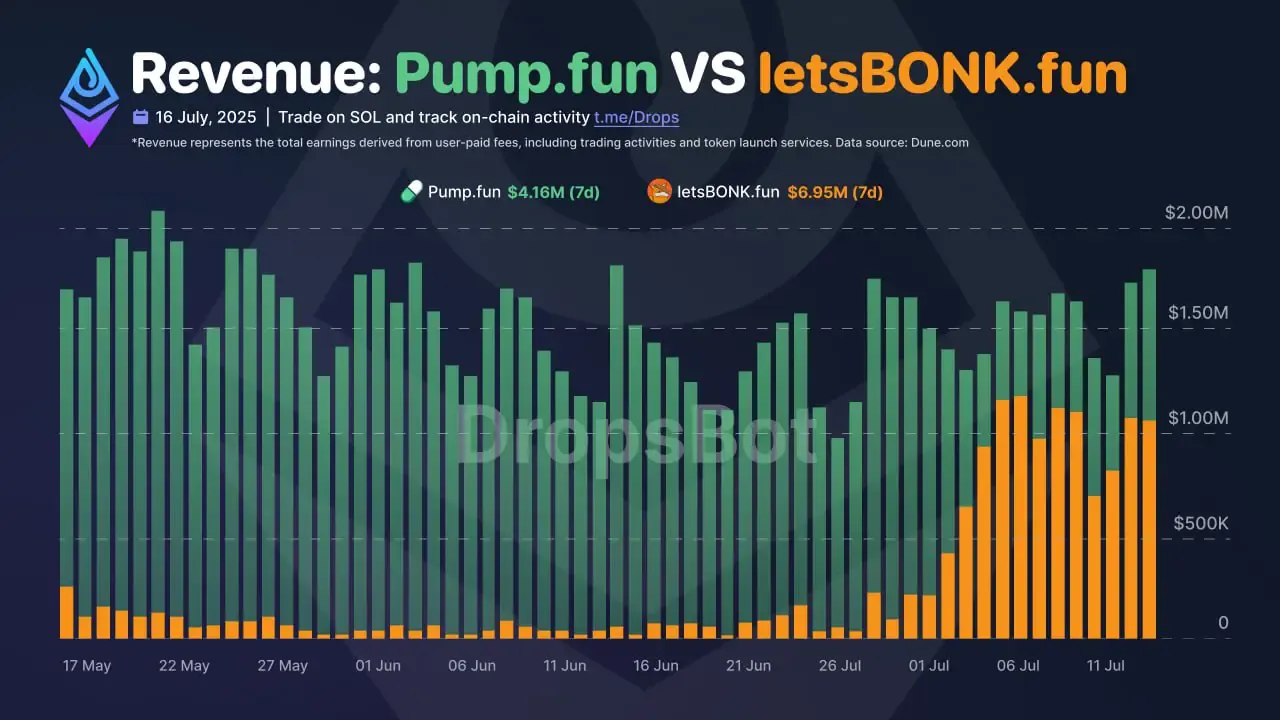
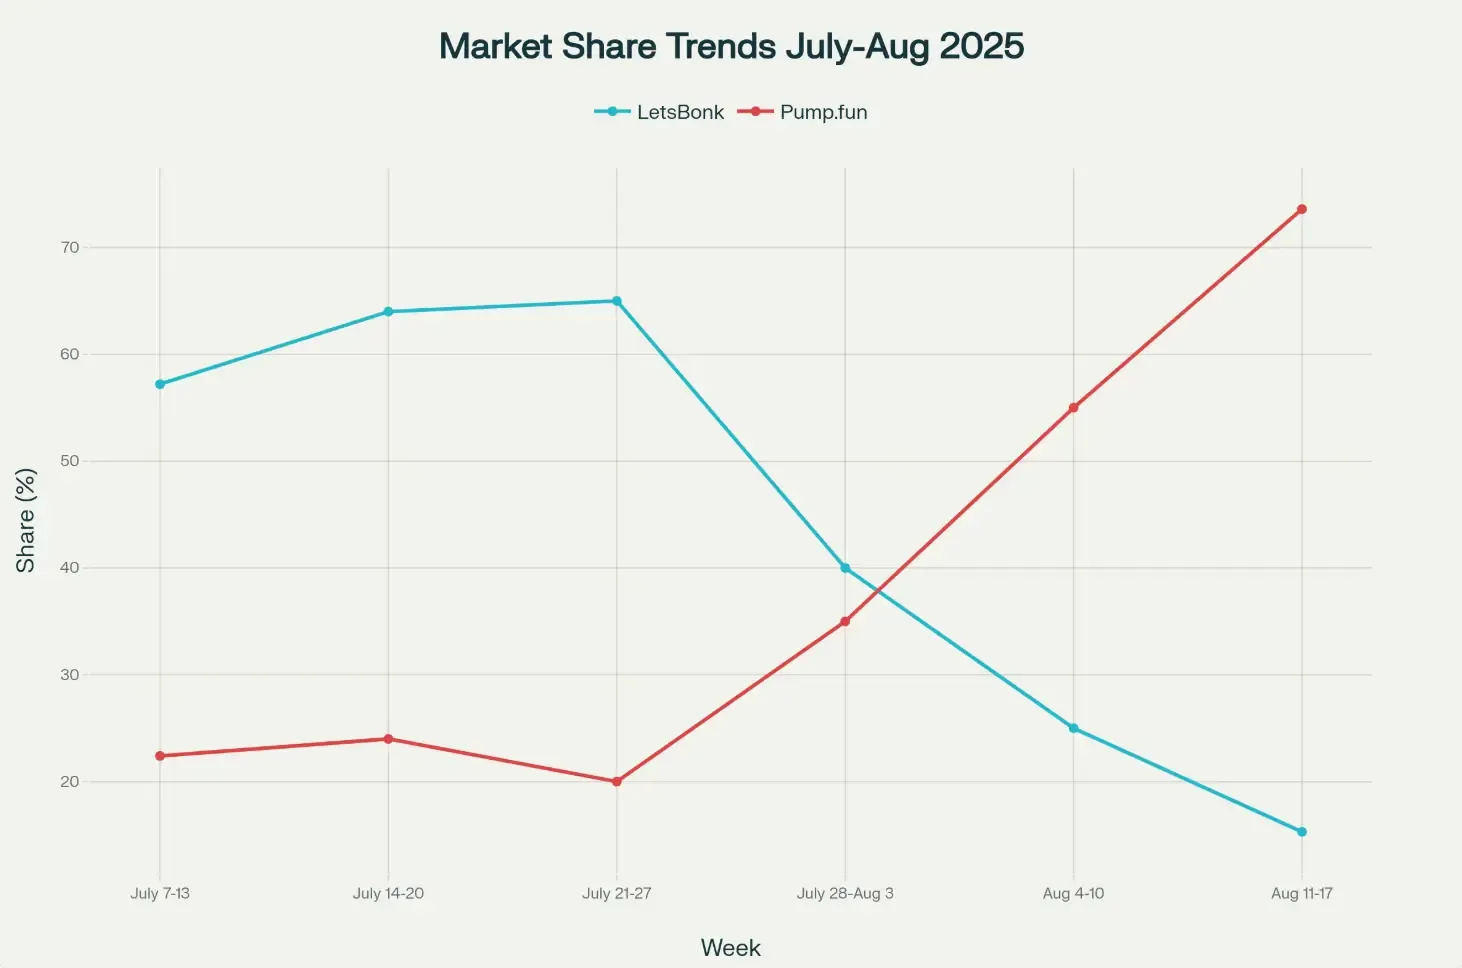
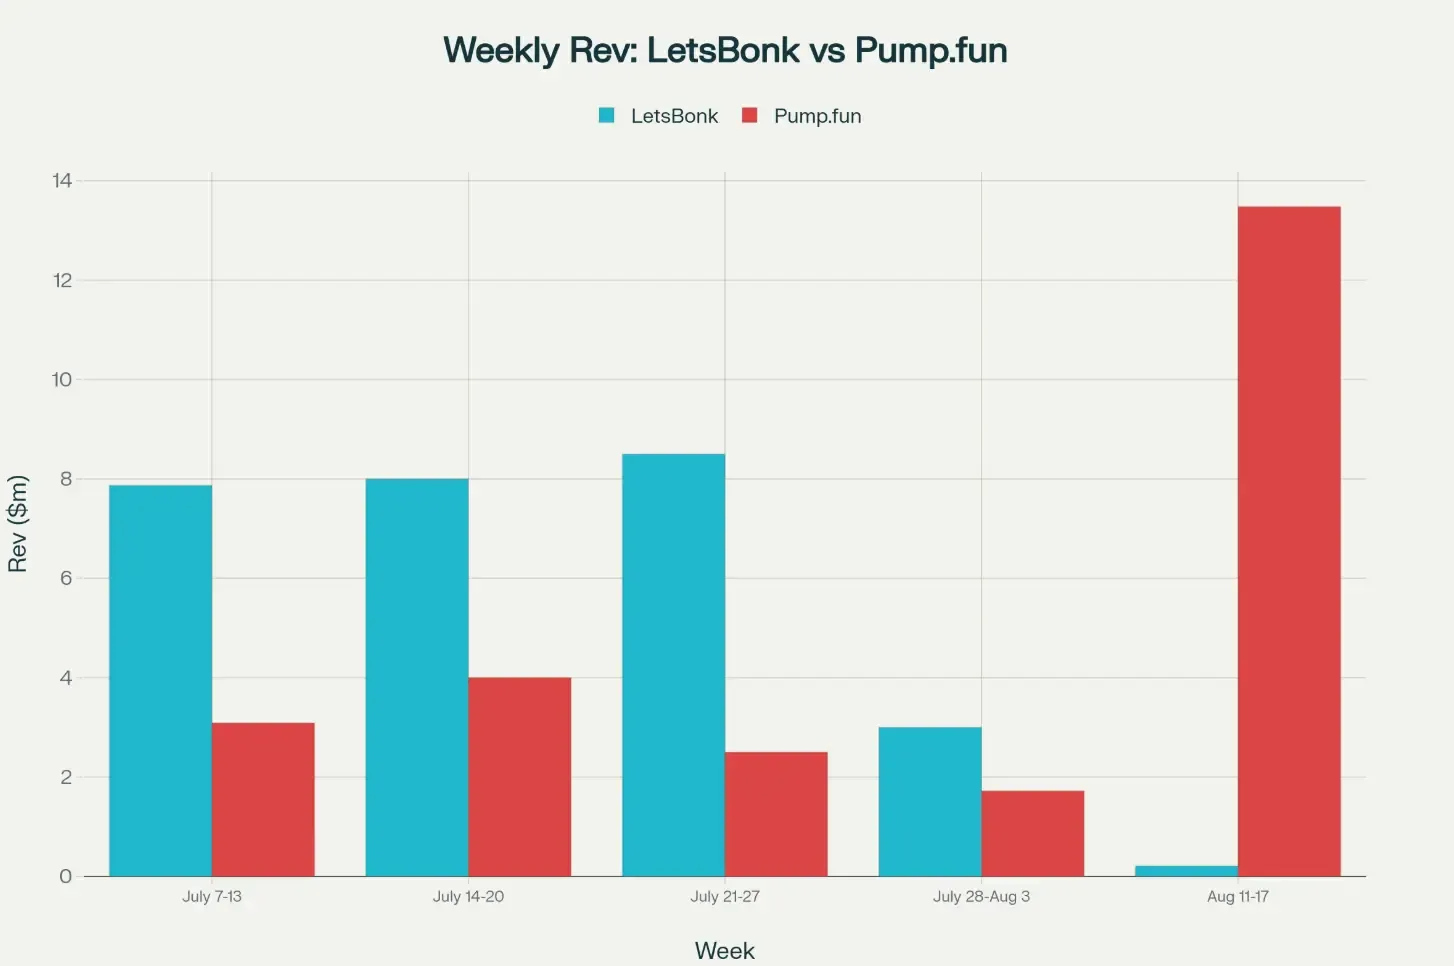
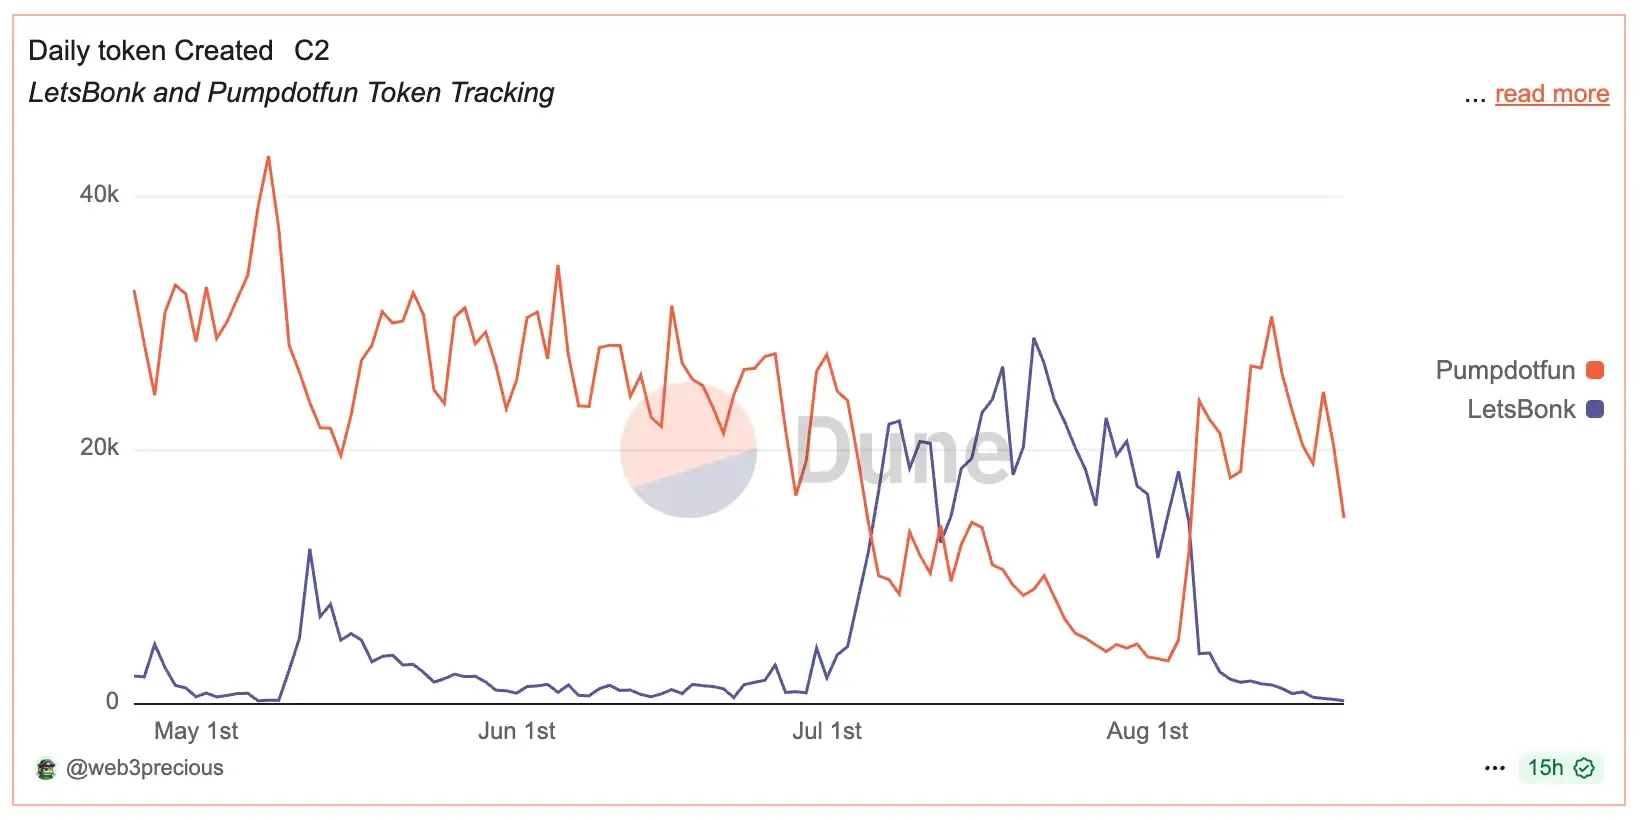
LetsBonk launched on April 25, 2025, but it gained real momentum in early July. On July 7 it even surpassed Pump.fun in 24-hour revenue. Between July 7–23, its market share grew from about 22% to 64% compared to Pump.fun. In that time, LetsBonk made about $7.9M in revenue, while Pump.fun made about $3.1M. This jump happened as the whole memecoin market was hot: Solana’s BONK token rose around 72% in late July, and Ethereum’s price also went up about 22%. Together, this excitement helped LetsBonk grab most of the trading and briefly pass Pump.fun in nearly every stat.
Phase 2: Peak and Decline
From July 21–27, LetsBonk hit its top point: it held about 64% of launchpad activity and saw huge single-day numbers, with over 26,600 new tokens and about $179M in trading volume. But this high point quickly led to a fall. By late July, the memecoin market slowed down: Pump.fun’s weekly revenue dropped to just $1.72M (July 28–Aug 3), the lowest since March 2024. At the same time, the total memecoin market value fell about 20%, from $77.7B on July 28 to $62.1B on Aug 3. LetsBonk’s strong July activity faded fast, and by early August token launches and trader counts were sliding, while Pump.fun started to recover.
Phase 3: Pump.fun Reclaims Dominance
By Aug 11–17, Pump.fun had taken back the lead. It held 73.6% of the launchpad market, making $13.48M in revenue that week. Around 1.37 million traders were active, and more than 162,000 new tokens launched on Pump.fun. LetsBonk was far behind with only 15.3% share, about 511,000 traders, and 6,000 new tokens. This shows Pump.fun’s traffic and users surged again as its fee system and rewards drew people back, while LetsBonk’s activity stalled. Data also shows Pump.fun’s share jumped from about 26% (Aug 4–10) to 73.6% (Aug 11–17), proving that many developers and traders quickly moved over.
Token Graduations and Survival Rates
One way to measure platform quality is token “graduation” – how many launched tokens move on to active secondary trading. Pump.fun has kept a steady graduation rate of about 0.8–1% of launches. In practice, it was graduating around 170+ tokens per day as of Aug 20, 2025, with an average fully-diluted token value (FDV) of about $80–100K. This shows the platform can consistently incubate some higher-value projects.
LetsBonk’s numbers look far weaker: at its peak in mid-July it was graduating around 200–300 tokens daily, but this collapsed quickly. By Aug 20, LetsBonk was graduating only about 5 tokens in 24 hours – a ~98% decline. This sharp drop indicates that very few projects launched on LetsBonk continued trading. In short, Pump.fun’s stable graduation rate compared to LetsBonk’s collapse points to stronger token survival on Pump.fun.
Revenue Models and Token Correlations
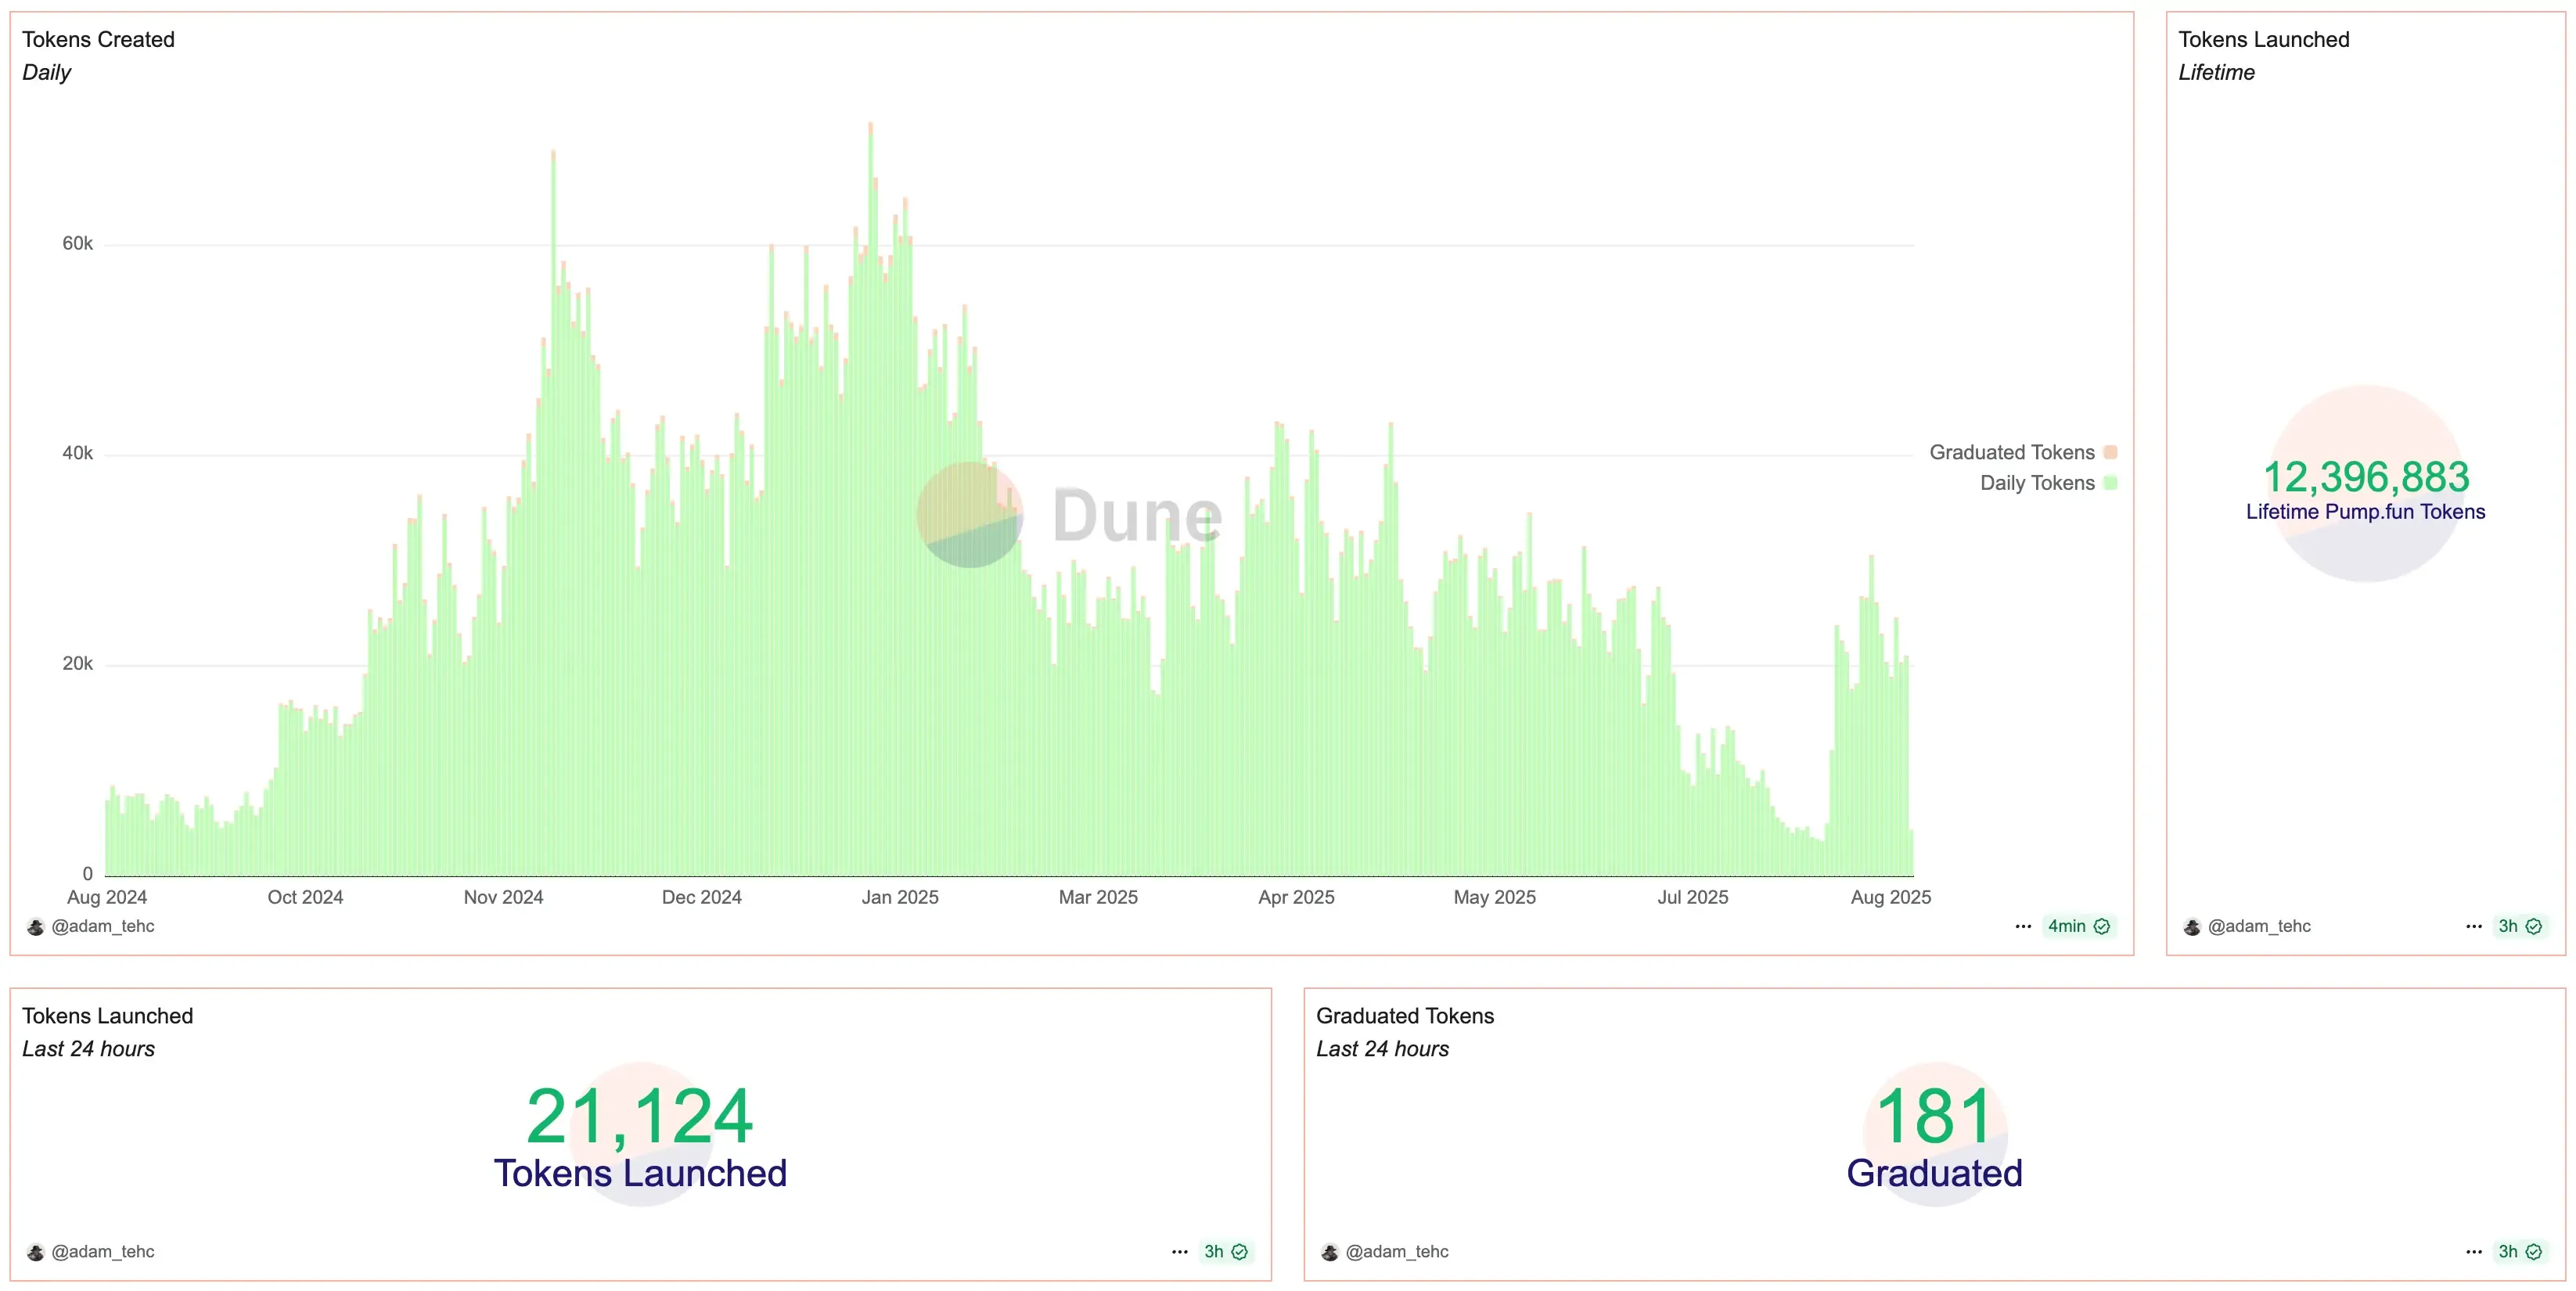
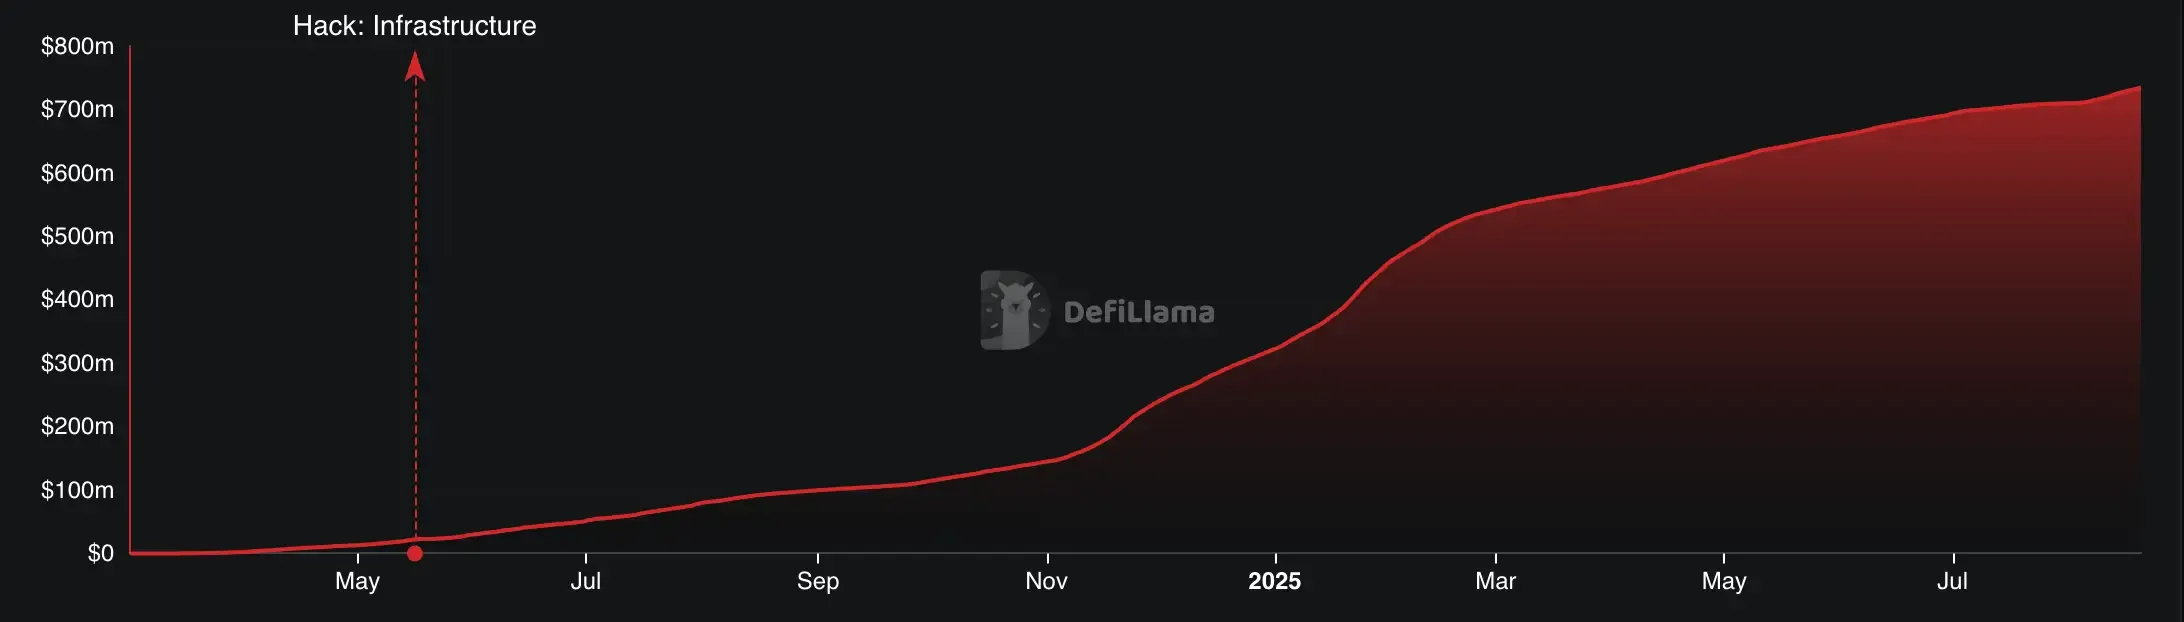
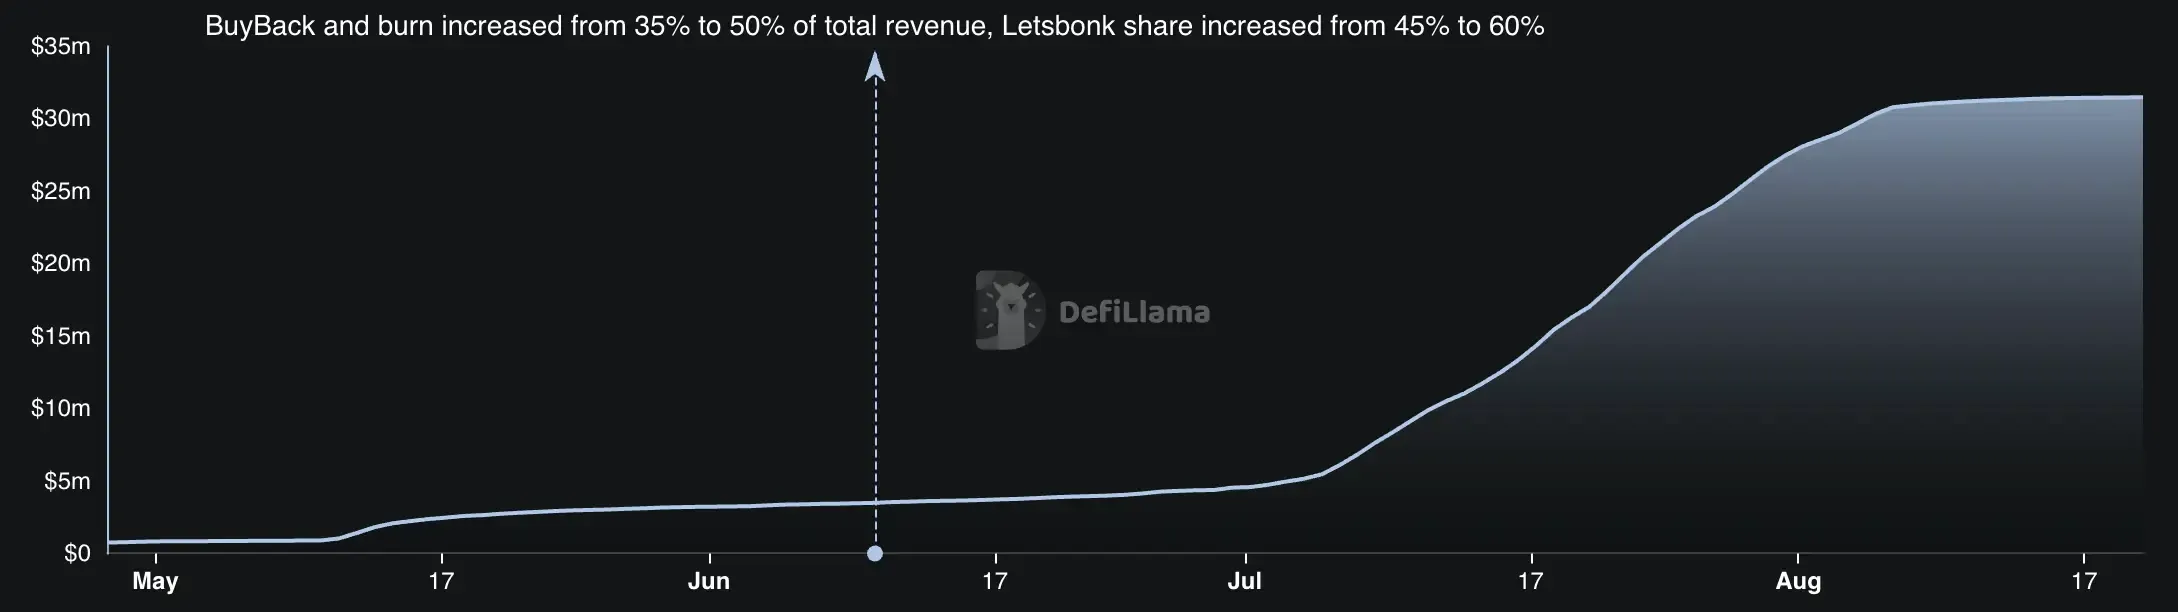
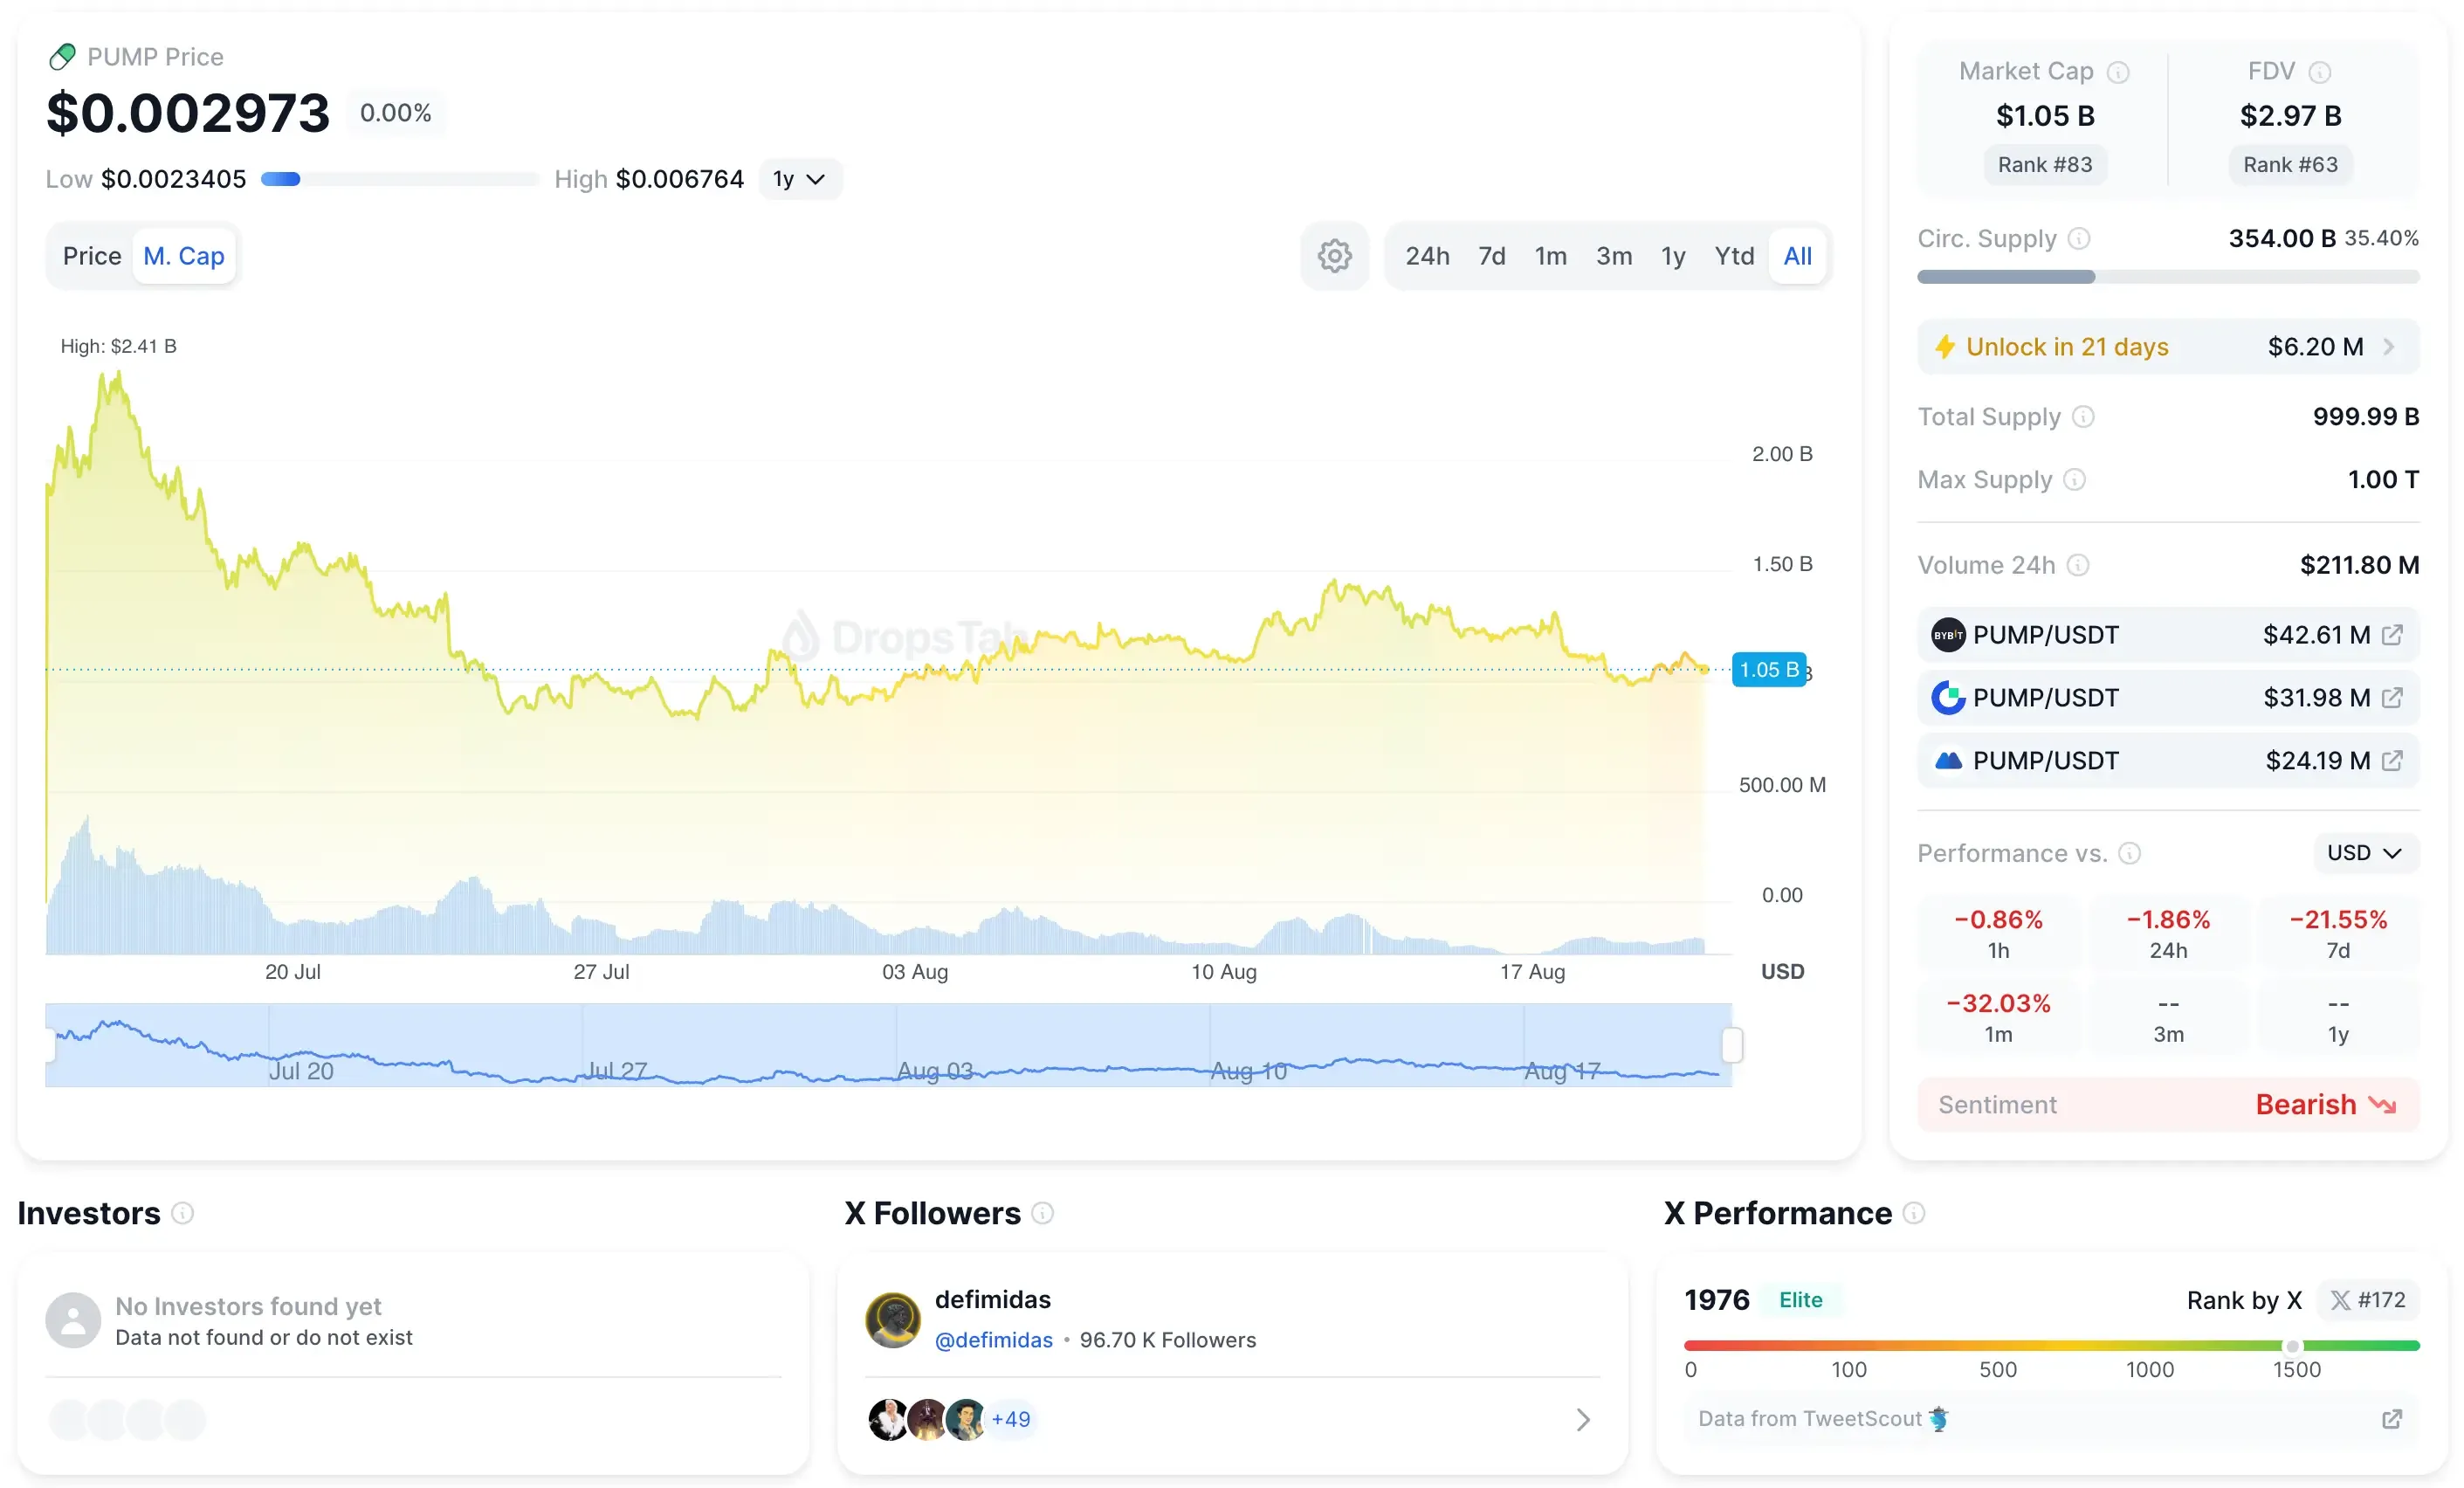
Pump.fun’s setup is simple: it charges a 1% fee on every trade. By Aug 20, 2025, this had added up to $800M in total revenue. With that money, Pump.fun could run big incentive programs, like a $33M buyback of its PUMP token and $500M worth of token sales in July. These moves helped the platform stay on top.
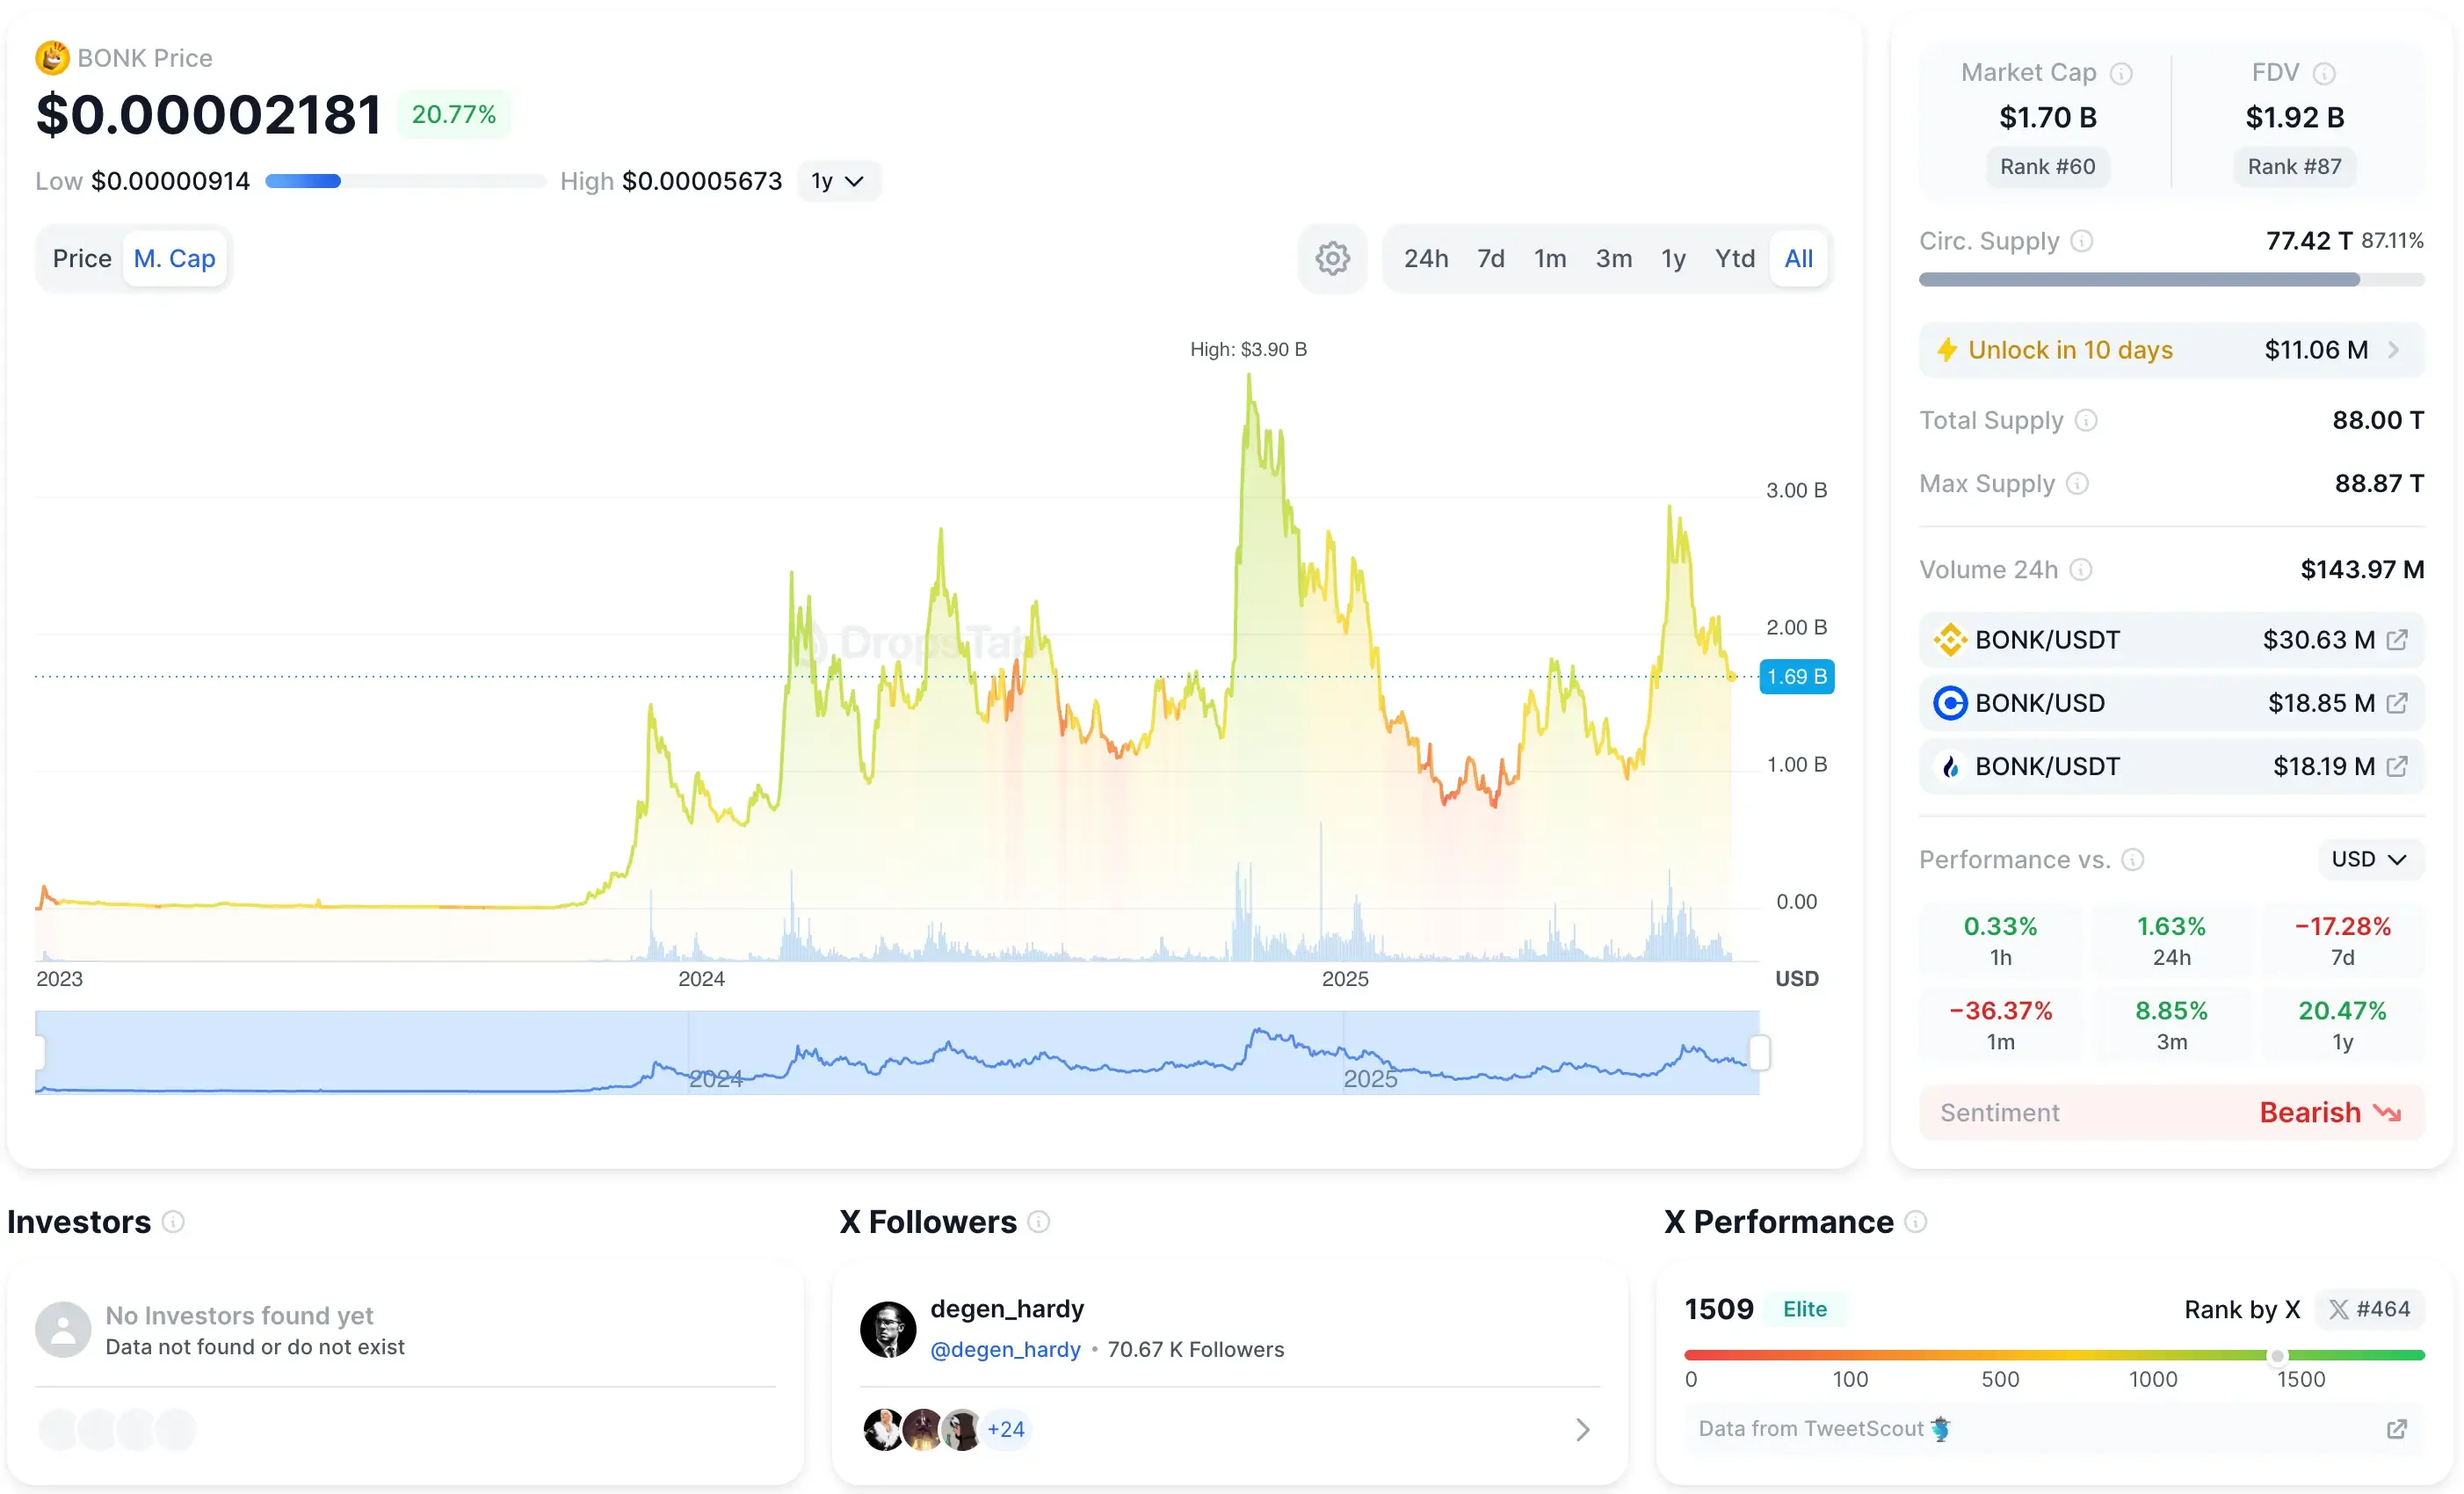
LetsBonk also charged a 1% fee, but split it up: 40% went to developers, 30% to validators, and 30% to buying back BONK tokens. This meant LetsBonk’s success was tied closely to the BONK token. During July, BONK’s market value jumped from $2.25B to $3.6B (about a 60% rise), showing strong interest in Solana’s meme coins. But when the hype cooled in August, this model couldn’t hold up. By mid-August, the link between BONK’s price and LetsBonk’s activity had broken down as volumes collapsed. We also broke down Bonk vs Shiba Inu on tokenomics, adoption, and catalysts.
In short, Pump.fun’s fee system gave it steady income and room to grow, while LetsBonk’s reliance on BONK made it much weaker.
Implications for Creators and Traders
The current gap between the two platforms matters a lot. For creators who launch tokens, Pump.fun has a much bigger and more active audience. From Aug 11–17 it handled about 162,000 new tokens, compared to only about 6,000 on LetsBonk – roughly 25 times more. Pump.fun also had almost three times as many active traders (1.37M vs 511K). More traders and higher trading volume mean a better chance that a new token will succeed. Pump.fun’s programs, like the Glass Full Foundation buybacks, also give new projects more confidence. For traders, Pump.fun is now the main place for meme tokens, with more liquidity and more reliable pricing.
LetsBonk’s future looks less bright. It grew quickly at first by using bots and incentives, but it never built strong support in the ecosystem. Because it depended heavily on BONK incentives, its growth slowed once BONK’s price leveled off. The sharp drop in token graduations (only 5 in one day) shows that very few new projects are lasting there. Observers note that Pump.fun still leads in trader count and liquidity, even when LetsBonk briefly earned more revenue.
In simple terms, most creators and traders looking for new Solana meme projects will choose Pump.fun or newer rivals like Bags and Heaven. The Solana meme market now depends on Pump.fun’s ability to keep offering rewards, and on whether LetsBonk can change to win back users. The August shift shows that platforms with steady fee models last longer, while those built on hype may fade away.
KPI Comparison (Mid-August 2025)
Market Share (Aug 11–17)
Pump.fun controlled 73.6% of the market, while LetsBonk only had 15.3%.
Weekly Revenue (Aug 11–17)
Pump.fun made $13.48M in a week. LetsBonk earned under $210K, which is less than $30K per day.
Active Traders (weekly)
About 1.37M people traded on Pump.fun, compared to 511K on LetsBonk.
Token Mints (weekly)
Pump.fun had more than 162,000 new tokens created, while LetsBonk had just over 6,000.
Graduations (Aug 20)
Pump.fun had over 170 tokens that kept trading, while LetsBonk had only 5.
Lifetime Revenue (Fee)
Pump.fun has brought in more than $800M in fees. LetsBonk has not shared its numbers.
Key Takeaways
Pump.fun’s comeback shows why a steady fee system and strong liquidity are important. Its 1% fee paid for buybacks and kept both creators and traders active, even after it lost ground. LetsBonk’s rise didn’t last long because it depended on BONK hype and bots, which faded quickly. For Solana, this change means most new meme projects will probably pick Pump.fun or similar platforms. In the end, token survival and liquidity matter more than short bursts of volume. Pump.fun looks like the steady option, while LetsBonk is a reminder of the risk of short-term strategies.