Crypto
How Does the Solana vs. Ethereum Correlation Impact Institutional Portfolios in 2026?
The early 2026 market is defined by a systematic re-coupling of Solana and Ethereum, with correlation coefficients surging to 0.88. This report dissects the mechanical drivers of this trend—specifically the impact of Kevin Warsh’s Federal Reserve nomination and the resulting "liquidity voids." We analyze the 17.5% volatility spread and provide a strategic verdict for institutional allocators navigating the shift from idiosyncratic alpha to macro-correlated beta.
Key Points
- The 30-day ETH/SOL correlation coefficient hit 0.88 in February 2026, destroying diversification theses
- Solana maintains a structural beta of 2.13 relative to Ethereum, amplifying downside risk during "risk-off" liquidity flushes
- Ethereum has entered a "dampened" regime (45% HV), while Solana remains a "volatility outlier" (68% HV) driven by leverage concentration
- The nomination of Kevin Warsh as Fed Chair signals a reduction in the central bank's balance sheet, stripping liquidity from high-beta assets
- Ethereum functions as the "Safety Trade" ($40.5B TVS), while Solana acts as the "Growth Trade," highly sensitive to macro liquidity shocks
The 2026 Macro-Mechanical Re-Coupling
The financial landscape of early 2026 is not defined by innovation, but by constraint. Rigorous analysis of market data from the first quarter reveals a decisive shift in risk appetite, heavily influenced by macroeconomic regime changes and the subsequent unwinding of speculative positioning from late 2025. The prevailing narrative entering the year—predicated on the "decoupling" thesis—suggested that Solana’s role as a monolithic execution layer would allow it to trade independently of Ethereum’s modular settlement layer.
The data refutes this.
The market structure governing price action has forced a violent re-coupling of these assets. The correlation coefficient between Ethereum (ETH) and Solana (SOL) surged to 0.88 in February 2026, significantly tighter than the 0.65 levels observed in Q4 2025. This is not merely a statistical anomaly; it is a mechanical failure of the diversification thesis. When the correlation approaches 1.0, the diversification benefits between the two largest smart contract platforms evaporate, leaving allocators exposed to concentrated macro risk.
The driver of this re-coupling is macro-mechanical. It is triggered by external pressures exerted by the transition in leadership at the Federal Reserve. The nomination of Kevin Warsh acts as a "regime shock". Warsh represents a stark departure from the accommodative policies of the past; he is a known critic of "mission creep" and a staunch advocate for shrinking the Federal Reserve's balance sheet.
In moments of regime shock, asset classes lose their idiosyncratic characteristics. They trade strictly based on their liquidity profiles. Algorithmic trading desks and high-frequency market makers (HFTs), which dominate short-term price discovery, group "Alternative Layer 1s" into a single risk basket. When "risk-off" signals trigger—driven by Warsh’s hawkish stance on quantitative tightening—liquidity is withdrawn indiscriminately.
The mathematical representation of this relationship is defined by the correlation coefficient:


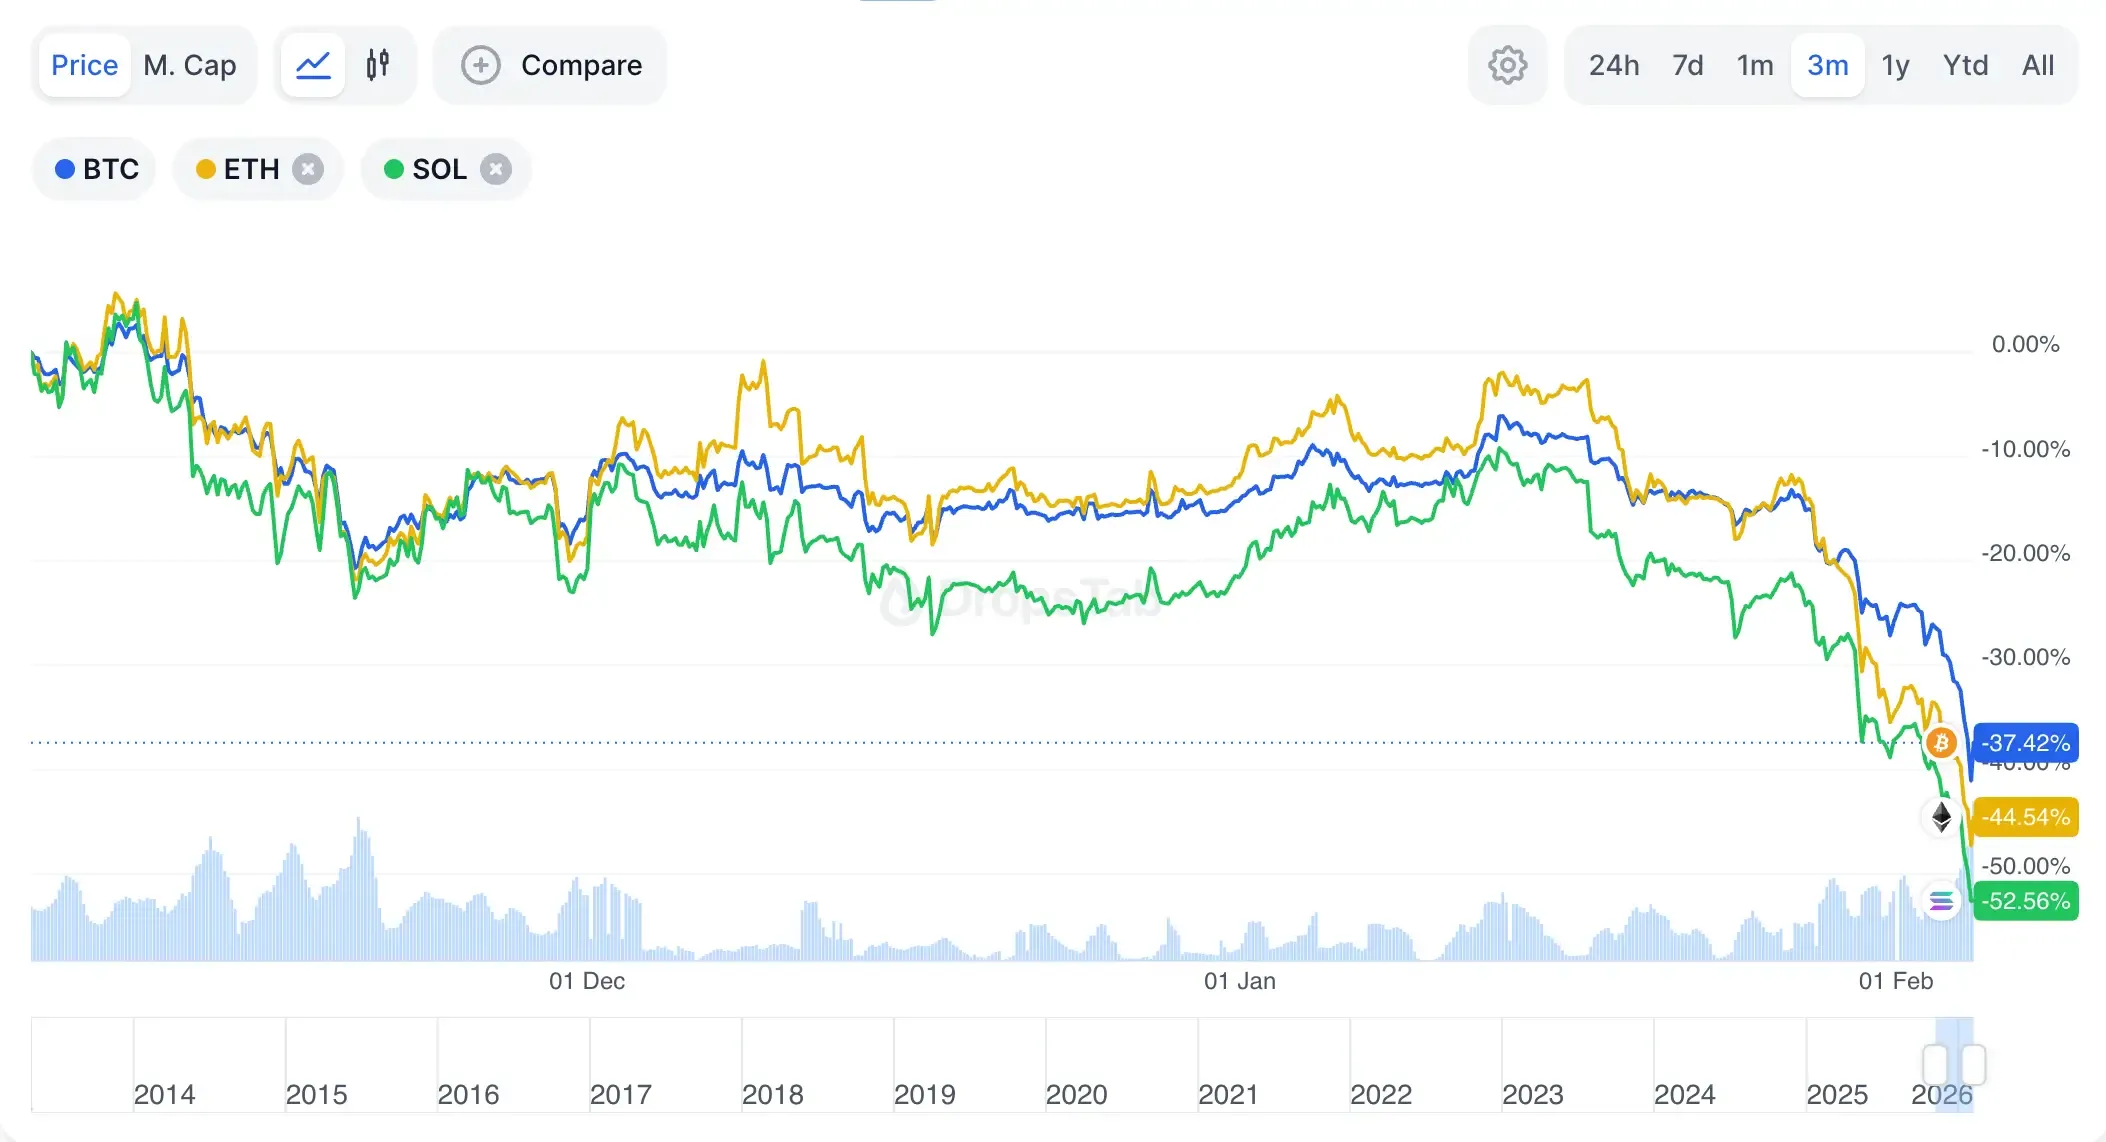
This coefficient confirms that idiosyncratic drivers—such as Solana's Firedancer upgrade or Ethereum's Pectra roadmap—are currently superseded by macro liquidity flows. The liquidation cascades of late January 2026, where Bitcoin’s break below $88,000 triggered a ~$7 billion flush, serve as the definitive case study. In this environment, neither asset traded on its utility; both traded as leveraged beta to Bitcoin.
The "Warsh Put" and Liquidity Voids
To understand the volatility dynamics of 2026, one must understand the "Warsh Effect." Kevin Warsh’s policy philosophy explicitly favors productivity over financial engineering and views the Fed's massive balance sheet as a liability.
This introduces a profound structural risk: The Liquidity Void.
Warsh has argued for a "Treasury-Fed accord" to shrink the balance sheet, signaling an end to the "Fed Put" that suppressed volatility for over a decade. For crypto markets, which act as high-beta sponges for excess liquidity, this is critical. When the central bank signals a withdrawal of liquidity, market makers widen their spreads to protect against inventory risk.
This creates "gappier" order books. In crypto, where market structure is already fragmented across dozens of exchanges, the withdrawal of market-making capital creates "liquidity deserts". When volatility spikes, liquidity vanishes.
Solana is particularly vulnerable to this mechanic. Due to its concentration of "hot money" and speculative leverage, Solana’s order books are thinner relative to its open interest compared to Ethereum. When a macro shock hits—such as a hawkish statement from the Warsh-led Fed—the price does not slide; it "teleports" through these liquidity voids, resulting in the massive volatility spreads we observe today.
Comparative Beta and Sensitivity Analysis
While correlation measures direction, Beta measures pain:

The current beta of Solana relative to Ethereum is 2.13. For every 1% drawdown in Ethereum, Solana typically realizes a 2.13% decline. This high beta is structural, stemming from the fundamental difference in holder composition and capital velocity between the two assets.
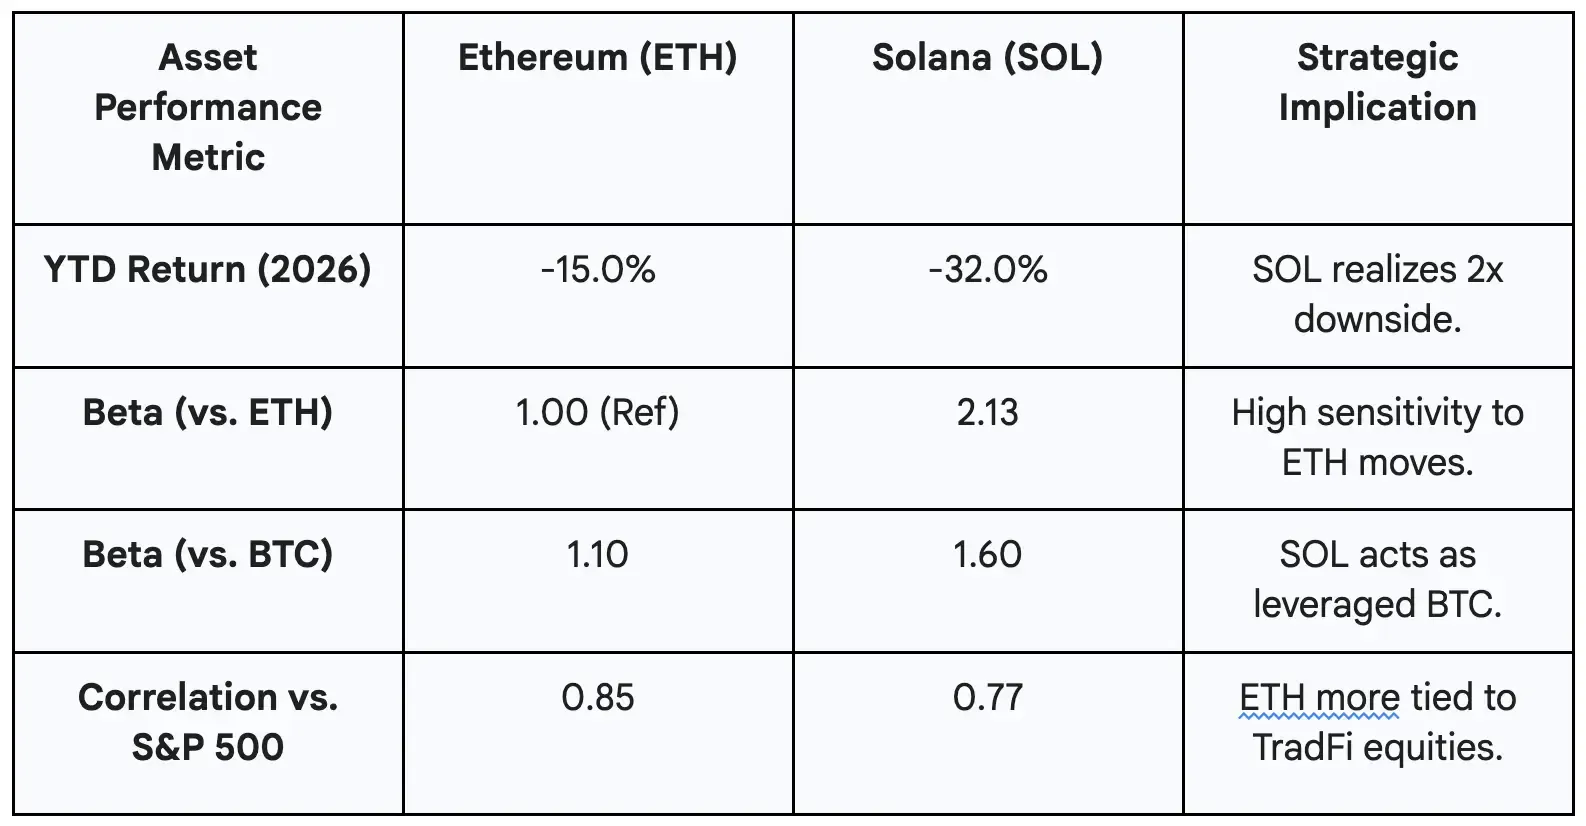
Ethereum benefits from "sticky" capital. It is supported by a massive base of Total Value Secured (TVS) on Layer-2 networks totaling $40.5 billion. This capital is predominantly passive, utilized as collateral in DeFi protocols, and locked in staking contracts. It is less likely to be sold during short-term volatility events.
Conversely, Solana's ecosystem is optimized for velocity. Its dominance in DEX volume and speculative trading means a larger portion of its liquidity is "hot money" pursuing short-term yield. When the market turns bearish, this hot money exits rapidly. This exacerbates downside moves and maintains the elevated beta relationship.
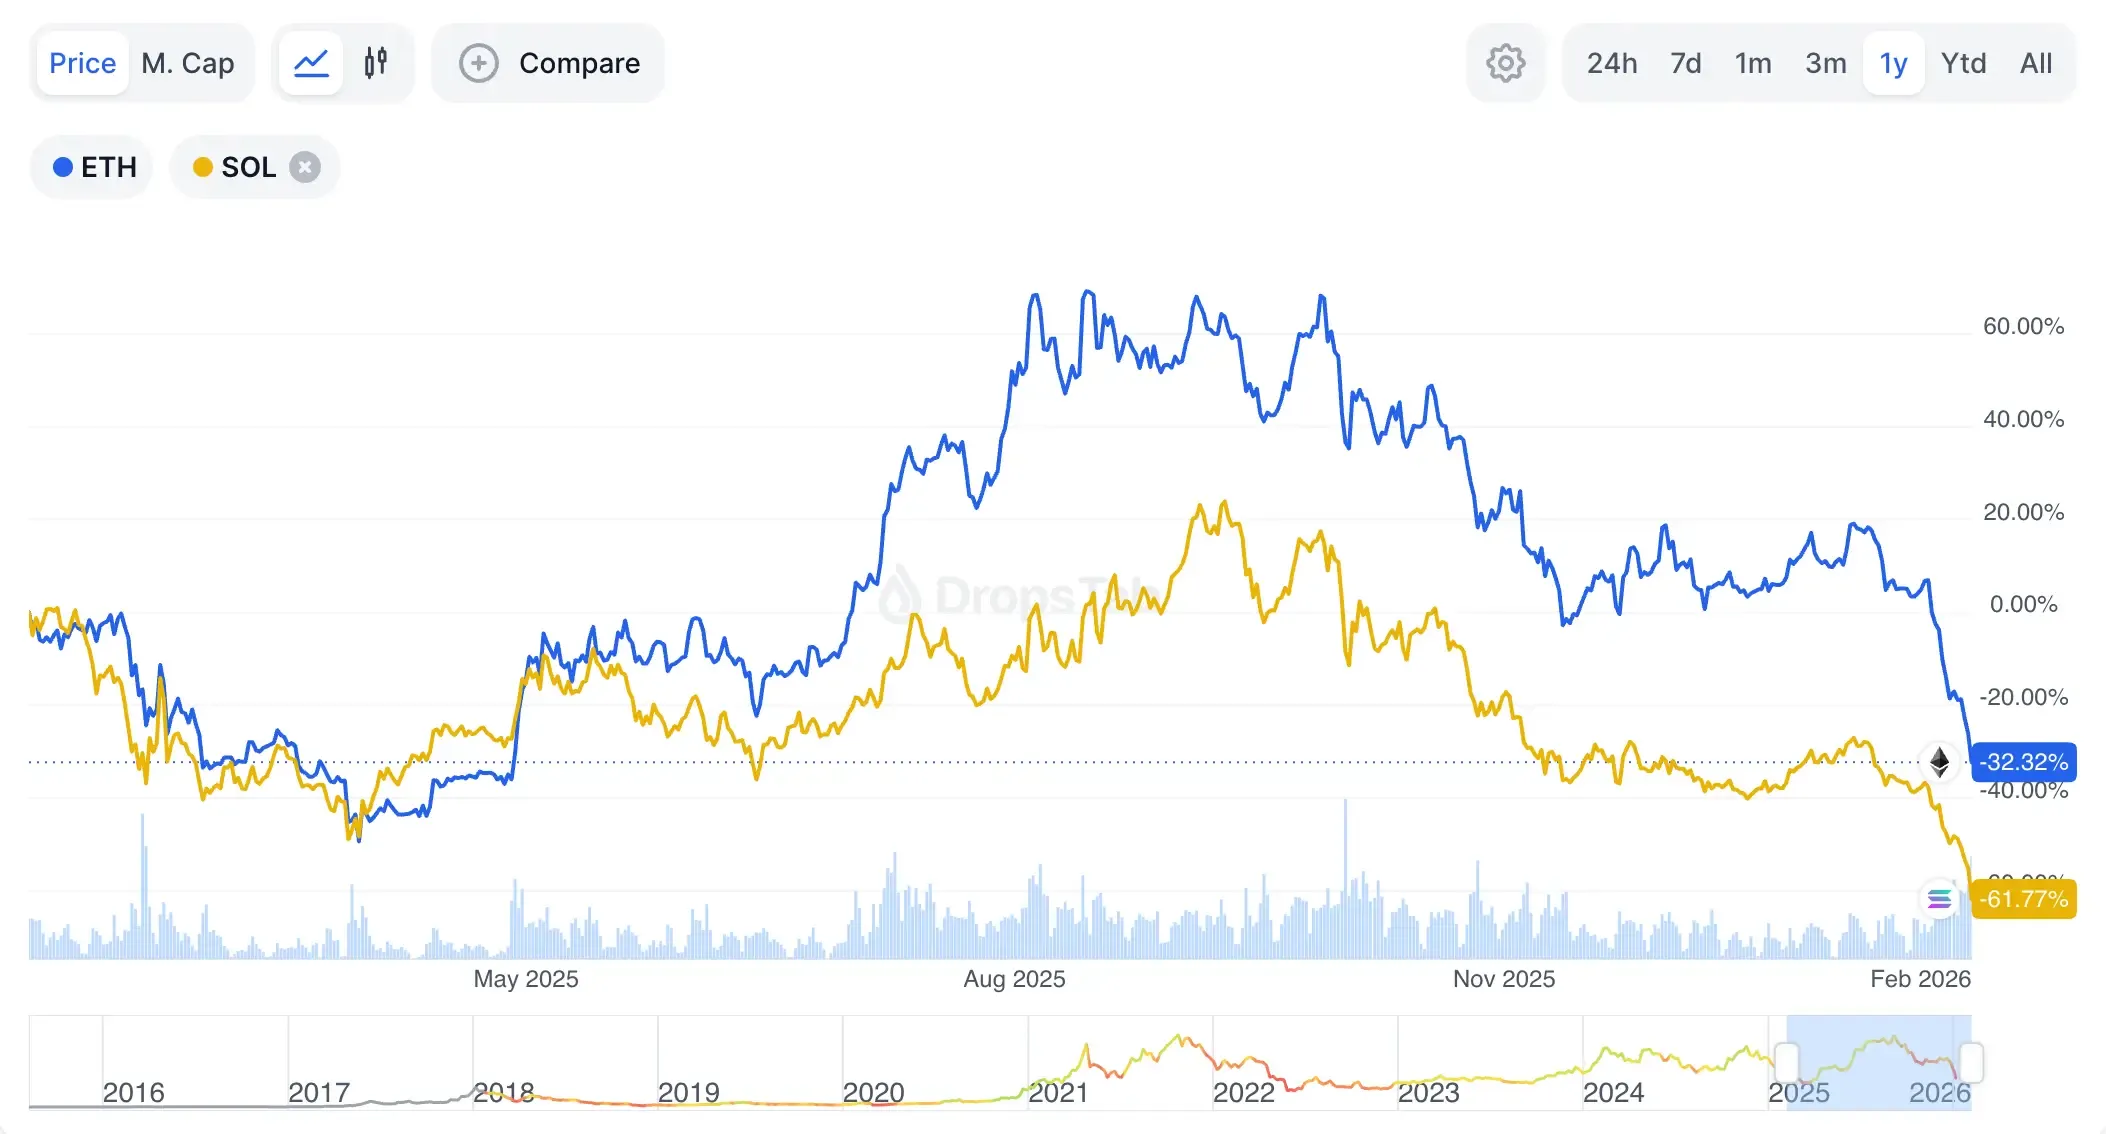
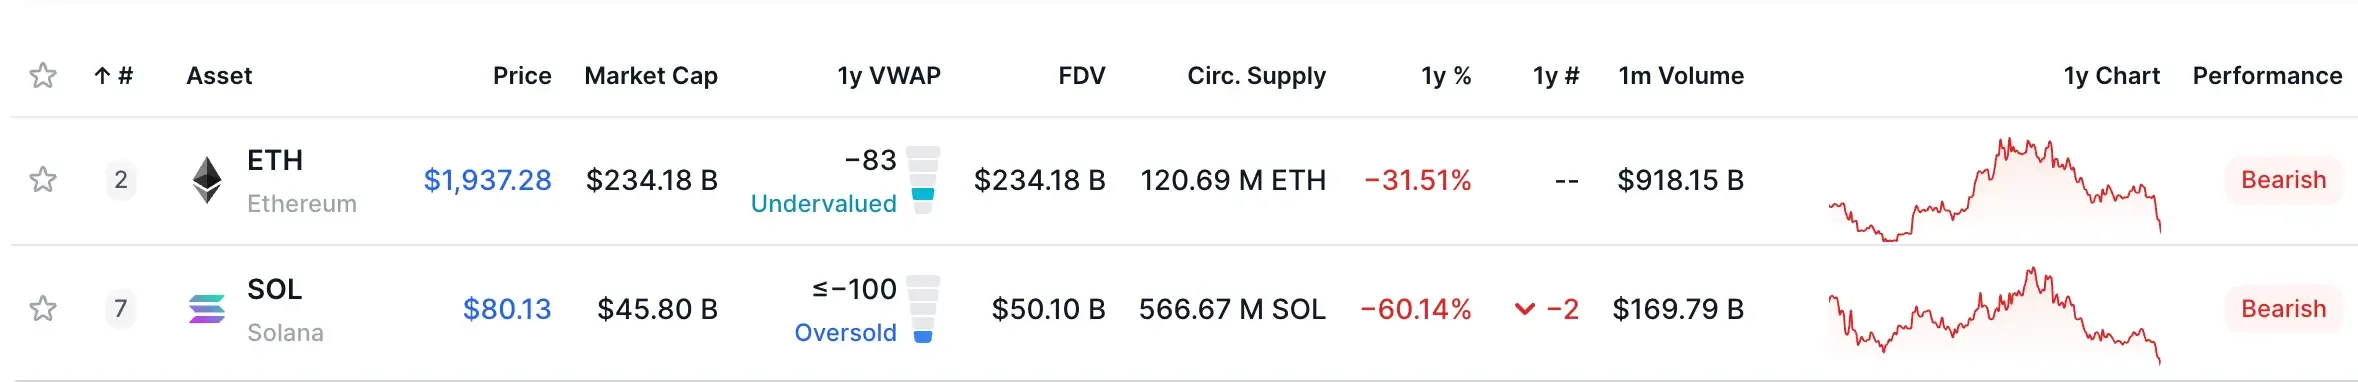
The beta relationship expanded on the downside in early 2026. With SOL down 32% year-to-date versus Ethereum’s 15% decline, the market is signaling amplified risk during liquidation events. Solana's thinner order book depth relative to its open interest results in greater price slippage compared to Ethereum, confirming the "liquidity desert" thesis.
The Volatility Gap Indicator
Volatility in early 2026 is no longer characterized by the chaotic, upward volatility of early adoption. It is "structure-driven" volatility, dictated by leverage dynamics and liquidity voids.
The annualized historical volatility (HV) for the total crypto market cap re-accelerated to ~44.6% in 2025. Within this regime, a clear bifurcation has occurred.
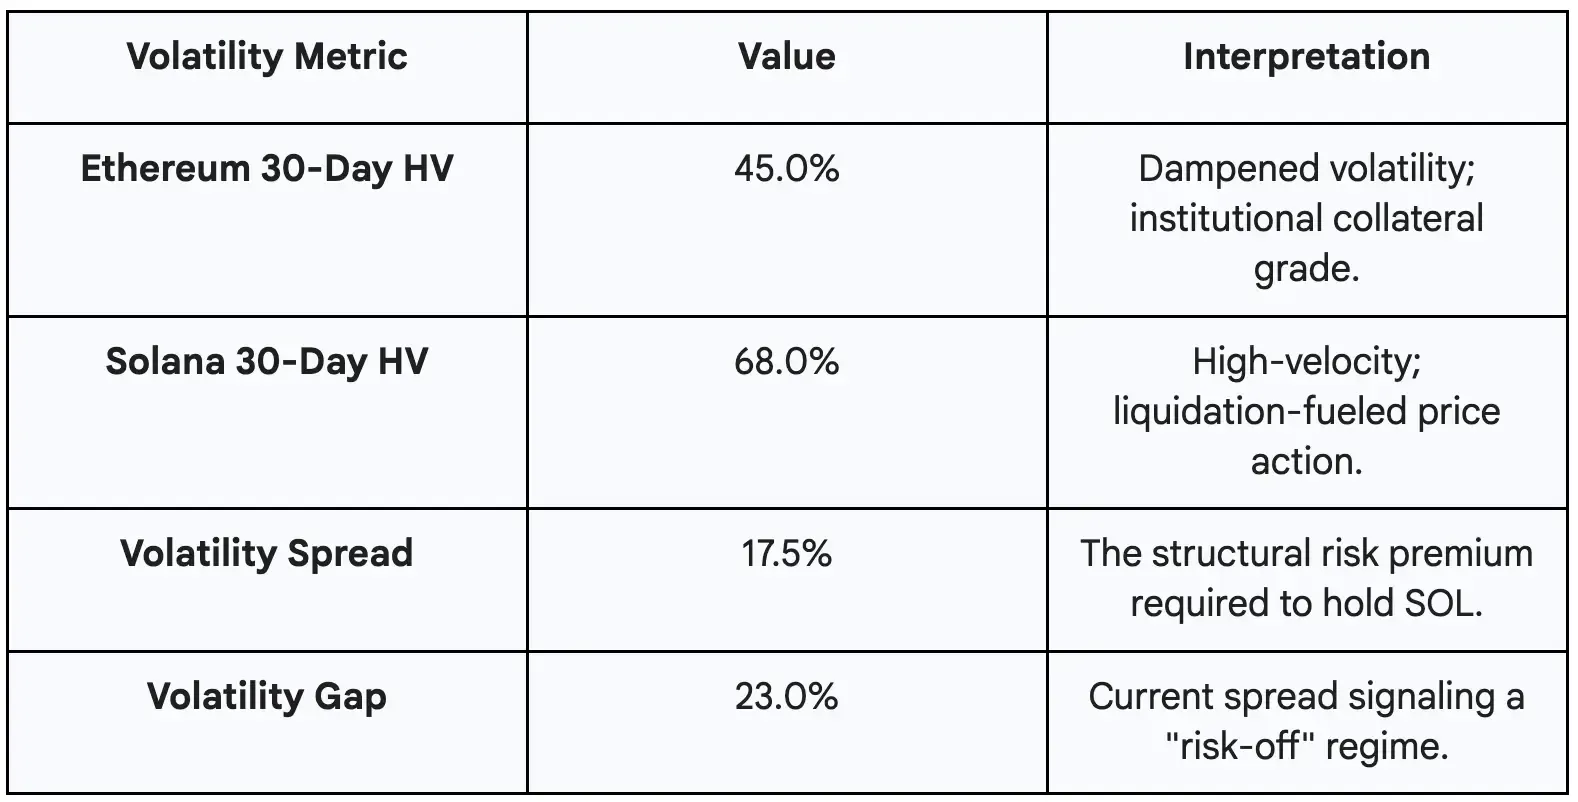
Ethereum: The Dampened Regime Ethereum has entered a "dampened volatility regime," with its 30-day HV hovering around 45%. This dampening is a direct result of the maturation of the Layer-2 ecosystem (Base, Optimism, Arbitrum). As high-frequency activity migrates to L2s, the L1 asset becomes a collateral instrument rather than a medium of exchange. Within the crypto risk curve, Ethereum is now categorized as the "low volatility" option.
Vitalik discusses targeted gas repricing and limit increases for Glamsterdam-era upgrades, data-centric evidence of Ethereum's shift to efficient, low-volatility collateral asset—supports "dampened regime" and L2 migration claims:
"Expect continued growth but more targeted / less uniform growth for next year... Potential targets for such increases."
Solana: The Volatility Outlier Solana remains a "volatility outlier" with a 30-day HV of approximately 68%. This 23% "Volatility Gap" (68% - 45%) is the defining metric for risk managers in 2026.
Two primary factors drive this gap:
- Leverage Concentration: Open interest in Solana derivatives swelled in late 2025 as traders bet on the Firedancer upgrade. When prices stalled, this leverage became a liability, triggering a "long squeeze" feedback loop.
- Liquidity Gaps: As discussed, Solana exhibits "gappier" order books during stress events. When market makers pull quotes—anticipating Warsh’s tight money policy—the price effectively falls through a vacuum.
Traders utilize this Volatility Gap to assess relative value. Historically, a wide gap (>20%) signals a local bottom or capitulation point for Solana, as it indicates maximum fear is being priced in. However, the persistence of this gap in Q1 2026 suggests this is not a momentary dislocation, but a structural repricing of risk under a new monetary regime.
Technical Roadmaps vs. Market Reality
While the dominant trend is correlation, distinct "decoupling events" occur when technical roadmaps collide with market narratives.
Solana: The Firedancer Paradox
The primary technological differentiator for Solana is the Firedancer validator client, launched in December 2025. Designed to increase throughput to over 1 million TPS and eliminate outages, Firedancer was the catalyst for the Q4 2025 decoupling. However, the "sell the news" reaction in early 2026 underscores a critical lesson: In a liquidity-constrained environment, technical upgrades provide diminishing returns on price action. The utility is real, but the capital required to price it in is absent.
Helius CEO (major Solana infrastructure provider) provides verifiable network metrics: 2+ years without outages and sustained 2k TPS amid volatility—direct technical evidence of Firedancer-era resilience gains, supporting article's Firedancer milestone despite "sell the news" dynamics in liquidity-constrained regimes:
"it is now feb 6... it's been 2 full years without a Solana outage... we're also now doing 2k tps on average, which would've been impossible during mass volatility not long ago."
For a deeper dive into the specific "Alpenlow" consensus upgrade and the vision of Solana as a global "message bus" for finance, watch this detailed breakdown by founder Anatoly Yakovenko:
Context: Anatoly Yakovenko outlines the next technical hurdles post-Firedancer and how high-throughput architecture specifically targets institutional finance.
Ethereum: The Institutional Shield
Ethereum’s roadmap—specifically the Pectra upgrade (Phase 1 May 2025) and the upcoming Glamsterdam upgrade (Q2 2026)—reinforces its "institutional grade" reliability. These upgrades focus on backend optimizations like Verkle Trees and Stateless Clients. While they lack the visceral appeal of high-throughput narratives, they entrench Ethereum’s status as the "Digital Bond" or "U.S. Treasury" of the crypto ecosystem.
For a granular breakdown of how these specific upgrades entrench Ethereum's stability, refer to the 2026 roadmap presentation:
Context: Vitalik Buterin details the technical specifics of "The Scourge" and "The Verge," explaining why stability and decentralization are being prioritized over raw L1 throughput.
This creates a "Value Capture" divergence. Ethereum faces headwinds where its L2-centric roadmap is perceived to "drain value" from the main chain. Conversely, Solana captures 100% of the economic activity on its L1. Yet, in 2026, the market prioritizes Ethereum’s burn mechanism (EIP-1559) over Solana’s inflationary security budget. Deflationary pressure acts as a soft floor during macro drawdowns; inflation does not.
Portfolio Risk: Sharpe Ratios and Drawdown Mechanics
For institutional allocators, the comparative analysis of risk-adjusted returns reveals a stark bifurcation. The Sharpe Ratio—excess return per unit of risk—is the arbiter of efficiency.
In 2026, Ethereum’s Sharpe Ratio has stabilized in the "moderate" range. It acts as a "beta-1" asset, capturing ~70% of the sector's growth while mitigating catastrophic "left-tail" risk.
Solana’s profile is "High-Variance Alpha." While it can exceed Ethereum's returns during bull phases, its Sharpe Ratio degrades rapidly in "risk-off" environments due to the severe volatility penalty. Passive holding of Solana in early 2026 has resulted in a lower Sharpe Ratio than Ethereum due to deeper drawdowns (~51% vs ~45% over 12 months).
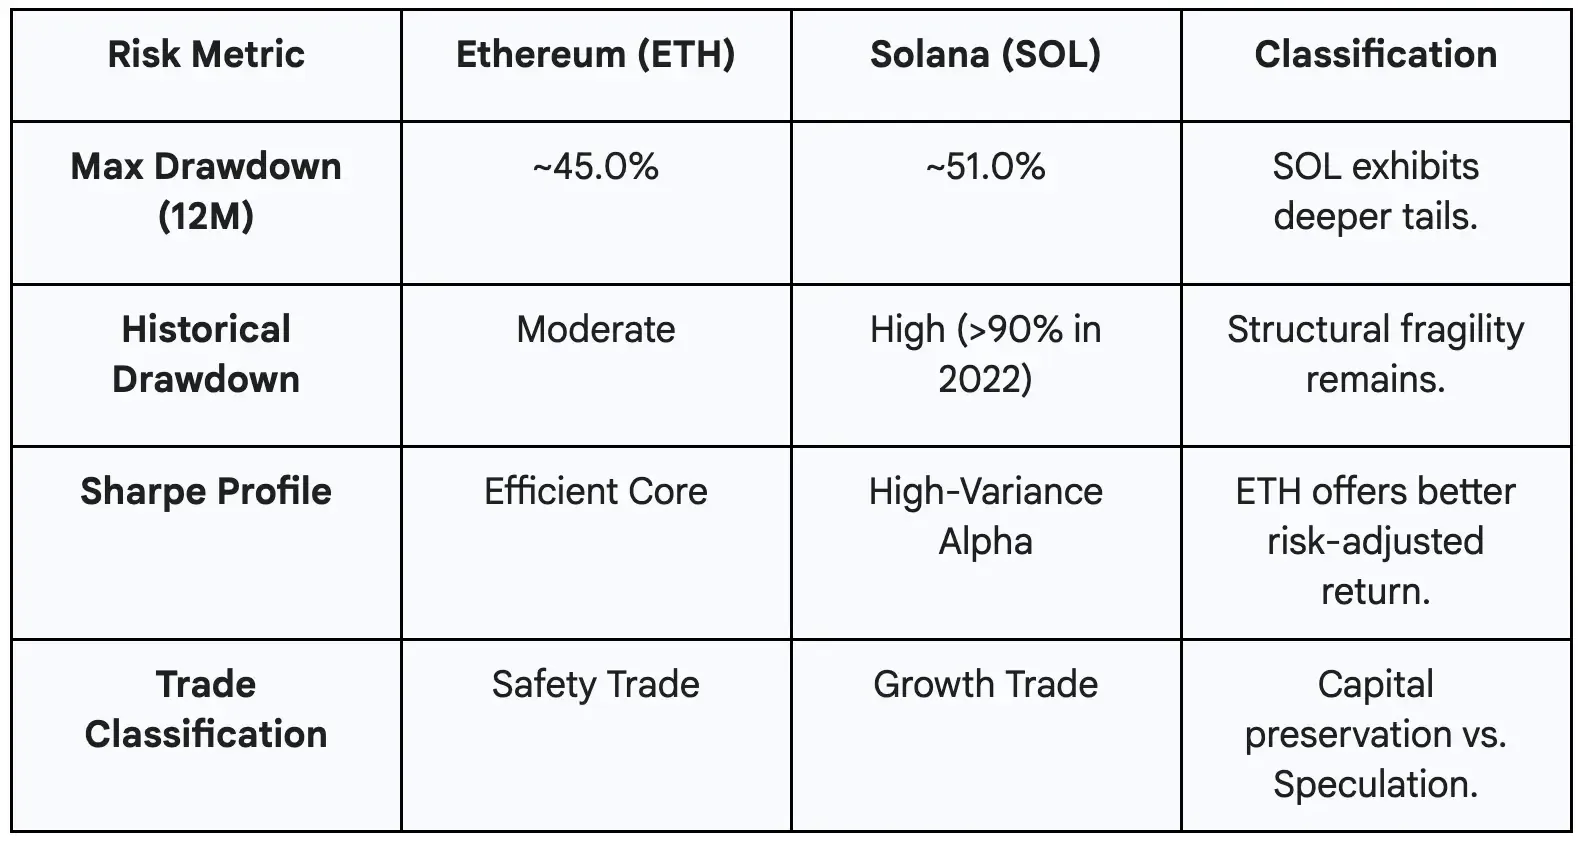
Ethereum’s drawdown is cushioned by institutional distribution and the $40.5 billion in "sticky" L2 collateral. Solana's drawdown profile is characterized by "wick" risk—rapid, deep price excursions driven by liquidation cascades that spot demand cannot immediately absorb.
The Verdict: Categorization and Outlook
As of February 2026, the market has reached a consensus on asset categorization.
Ethereum is the "Safety Trade." It functions as the monetary base of the on-chain economy, prioritizing collateral utility and lower volatility. It is the asset allocators buy when they must be in crypto but cannot afford to be wrong.
Solana is the "Growth Trade." It is a technology play, categorized alongside emerging market equities or high-growth tech stocks. It offers high alpha potential but remains prone to capital flight and inflationary headwinds.
In the current regime—defined by Kevin Warsh’s looming balance sheet reduction and tariff-induced volatility—the "Safety Trade" is objectively outperforming on a risk-adjusted basis The correlation coefficient of 0.88 confirms that diversification is currently an illusion.
Strategic Implication: For market participants, the $93 support level on SOL and the ETH/SOL correlation coefficient are the critical monitors. A breakdown in correlation below 0.75 would signal the return of idiosyncratic drivers. Until then, risk management dictates prioritizing the lower-beta profile of Ethereum, utilizing Solana only for tactical, high-conviction alpha generation, fully hedged against the liquidity voids that define the 2026 landscape.
The data is undeniable. The decoupling is over; the regime of high-correlation macro dominance has begun.