Product
How to Read Vesting & Token Unlocks on DropsTab
Token unlocks move prices long before headlines do. This guide shows how traders use DropsTab’s vesting charts and unlock tools to identify supply risk, avoid poorly timed entries, and trade with dilution in mind.
Key Takeaways
- Vesting charts show where future supply comes from.
- Unlock tables show when supply becomes tradable.
- Large cliffs and insider allocations increase downside risk.
- Absorption ratio reveals whether liquidity can handle an unlock.
- DropsTab helps you avoid trading into known, scheduled selling pressure.
How to Read Crypto Vesting Schedules on DropsTab
This is the core of how traders actually use DropsTab — as a risk filter before entering a position. Scroll down any token page and you’ll see the vesting schedule — horizontal bars split by allocation (team, investors, ecosystem, community, etc.).
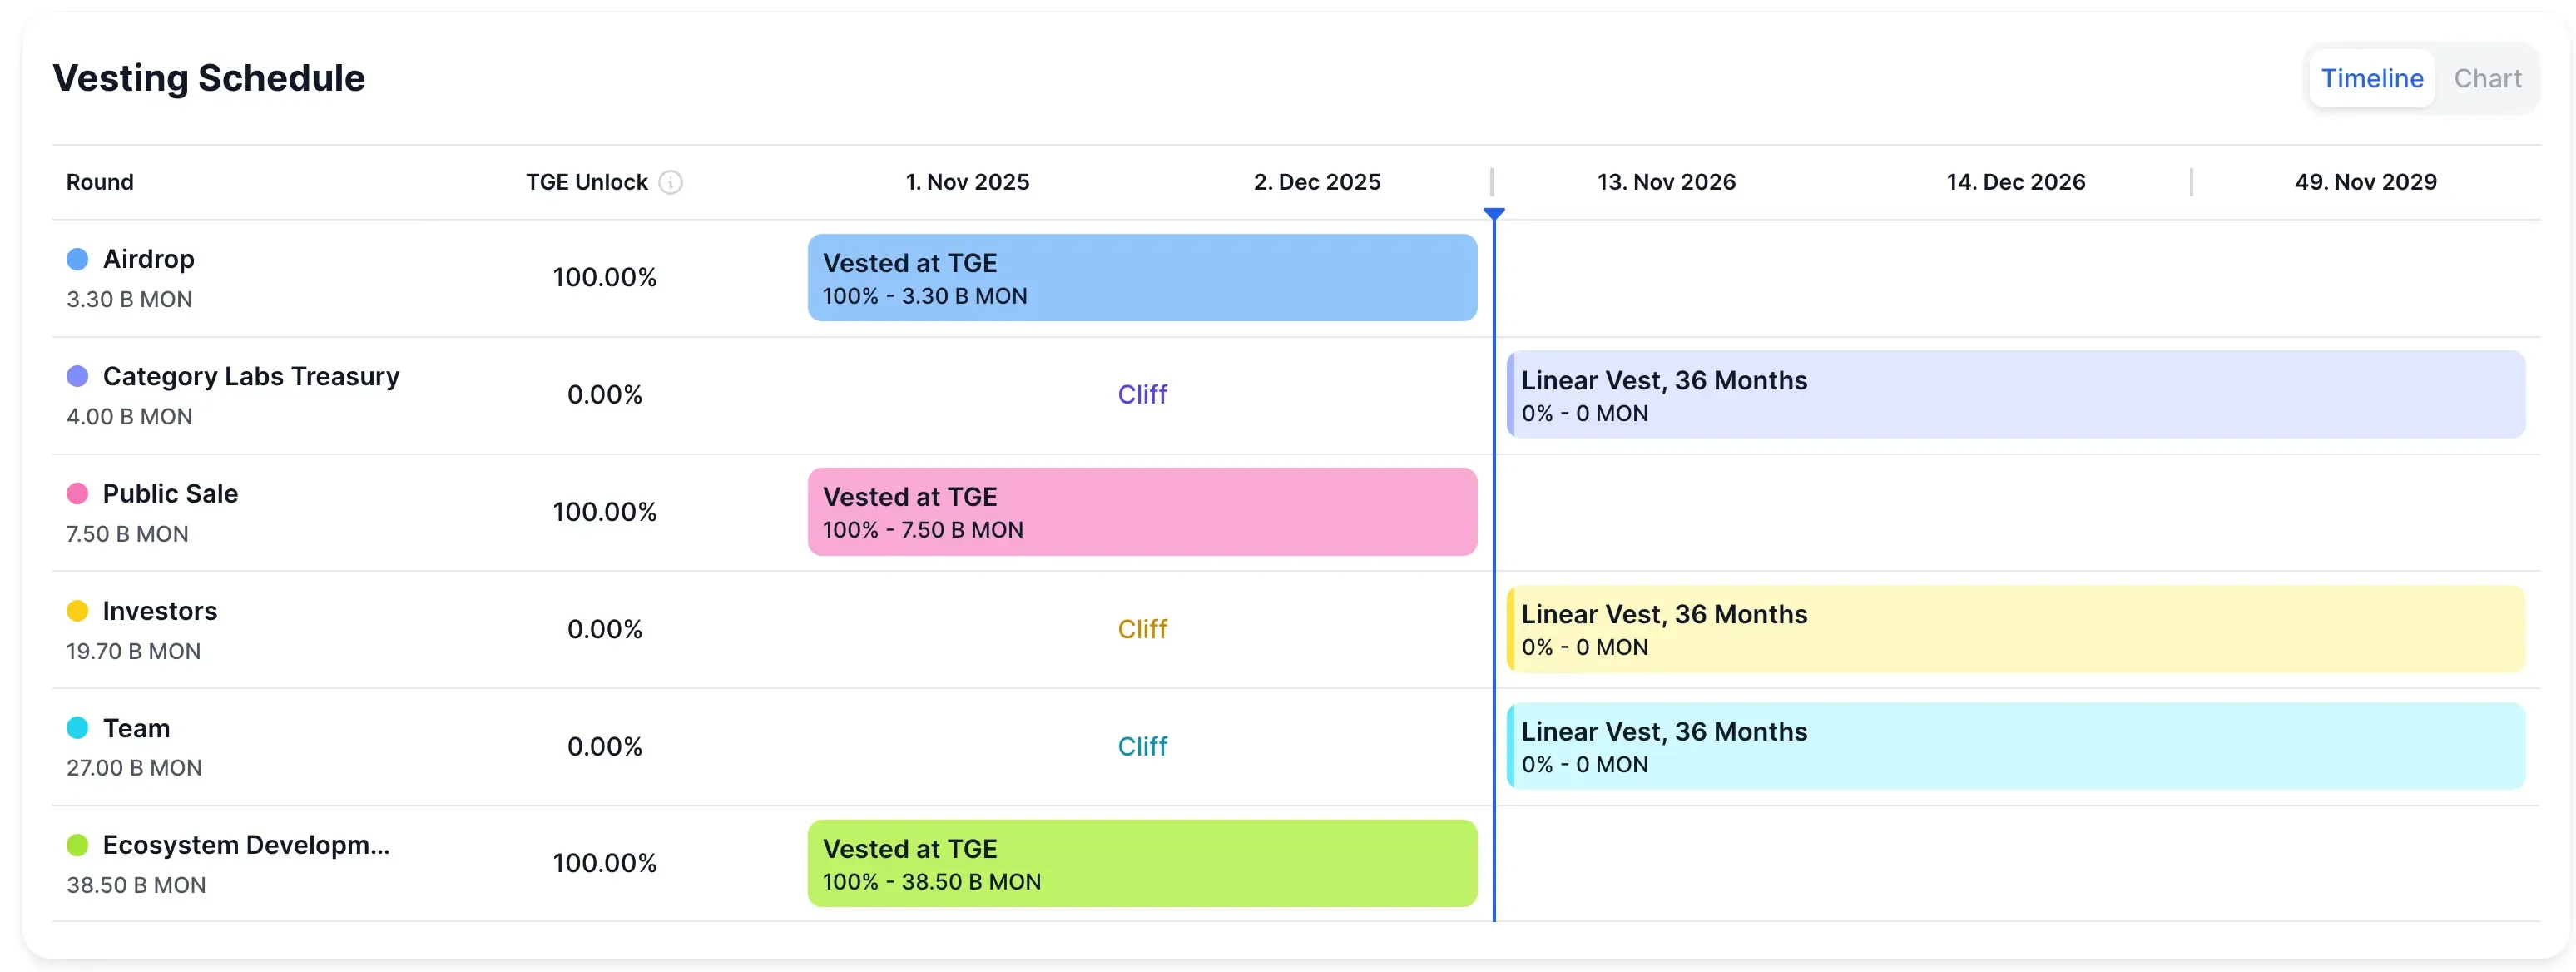
Understanding the Vesting Chart (Monad Example)
Each row = one allocation bucket (Airdrop, Public Sale, Investors, Team, Ecosystem, Treasury). The number under each label is the total size of that allocation, not what’s circulating yet.
“Vested at TGE – 100%” → Airdrop, Public Sale, Ecosystem = 100% vested at TGE. These tokens are already in circulation. No future unlock risk here.

“Cliff – 0.00%” → Zero tokens are tradable until the cliff date. This is delayed sell pressure. Risk starts at the cliff, not before.

“Linear Vest, 36 Months” → Investors, Team, Treasury = 0% unlocked today. These allocations are fully locked, then unlock after a cliff and release linearly over 36 months. This is where future supply pressure comes from.

The vertical blue line = today. Everything to the right = future supply risk. Everything to the left = already completed and priced-in supply.
Why Vesting Data Helps Traders Avoid Common Losses
Most “overnight craters” caused by scheduled unlocks traders didn’t check. Using DropsTab enforces three capital-protecting habits:
- You don’t enter blindly days before a known unlock
- You size positions with dilution in mind, not just price
- You wait for supply to clear before building conviction
Price often looks emotional. Supply isn’t — and DropsTab makes it visible before it trades against you.
How to Read Token Unlocks on DropsTab
If the vesting chart shows where supply comes from, the Token Unlocks tool shows when it hits the market.
Also, you can design a supply pressure scanner using custom Tabs (example, “Unlock-Free Windows” table). It surfaces projects that do not have major unlocks ahead, meaning there’s no immediate, scheduled selling risk in the near window.
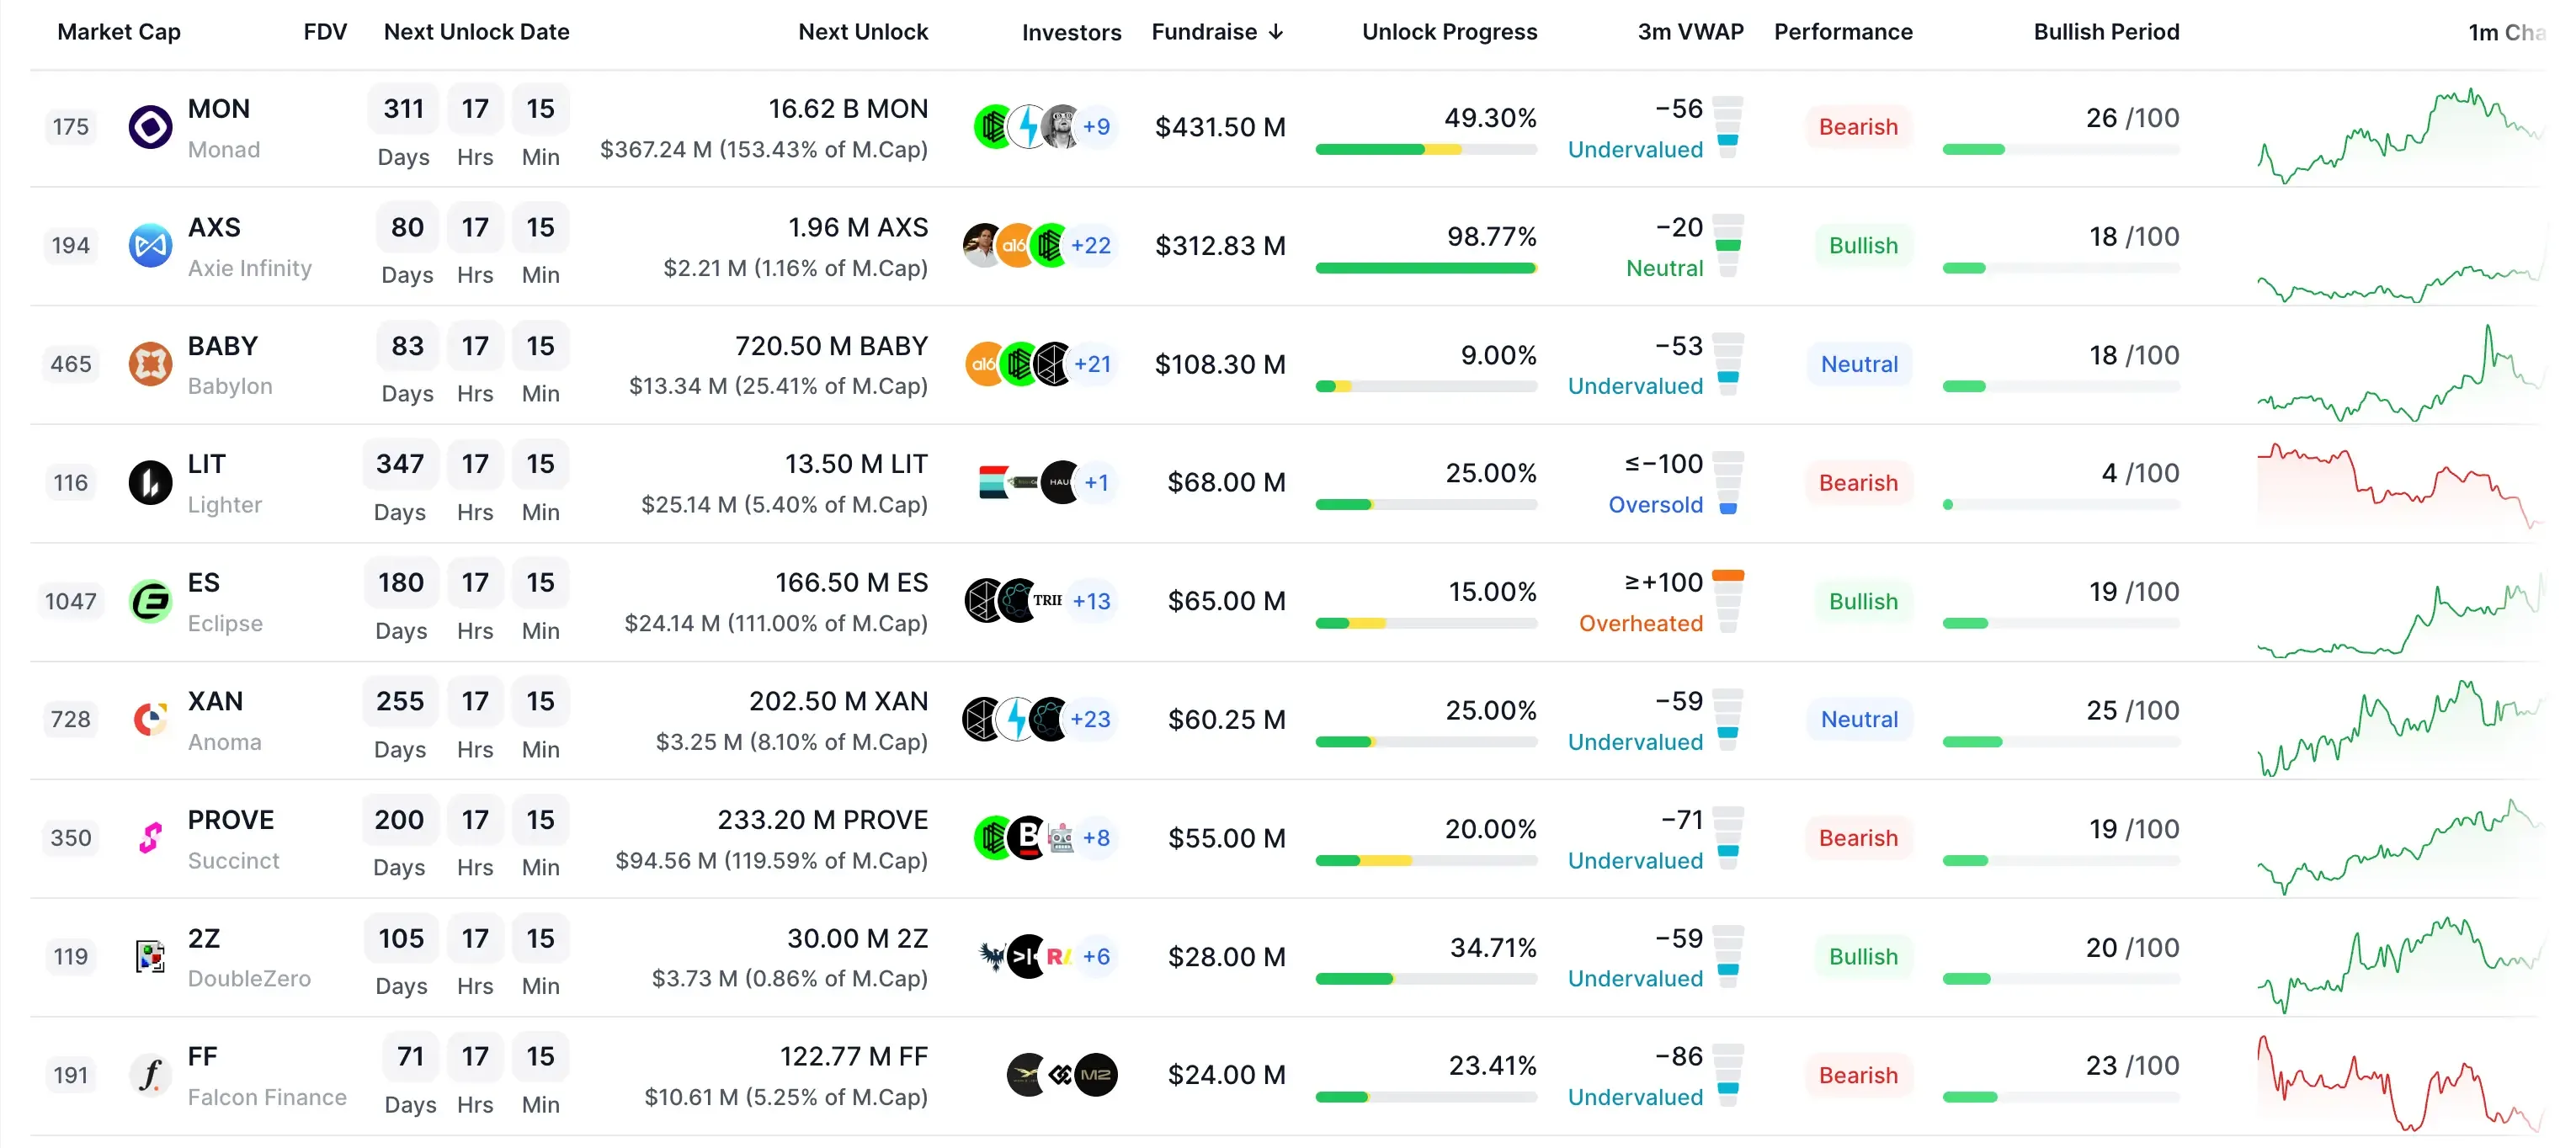
How to Read the “Unlock-Free Windows” Custom Tab
Each row represents one asset, with the most important fields for analytics:
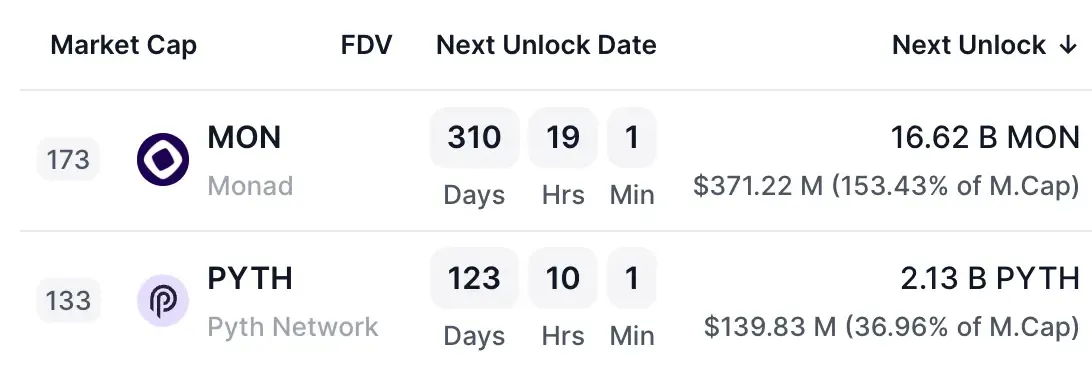
Next Unlock Date. A countdown to the next time tokens become tradable. If this is far away, there’s no near-term supply event to worry about.
Next Unlock (Amount + % of Market Cap). This is the key filter. Unlocks shown as a small percentage of market cap signal low absorption risk. Large percentages flag potential volatility.
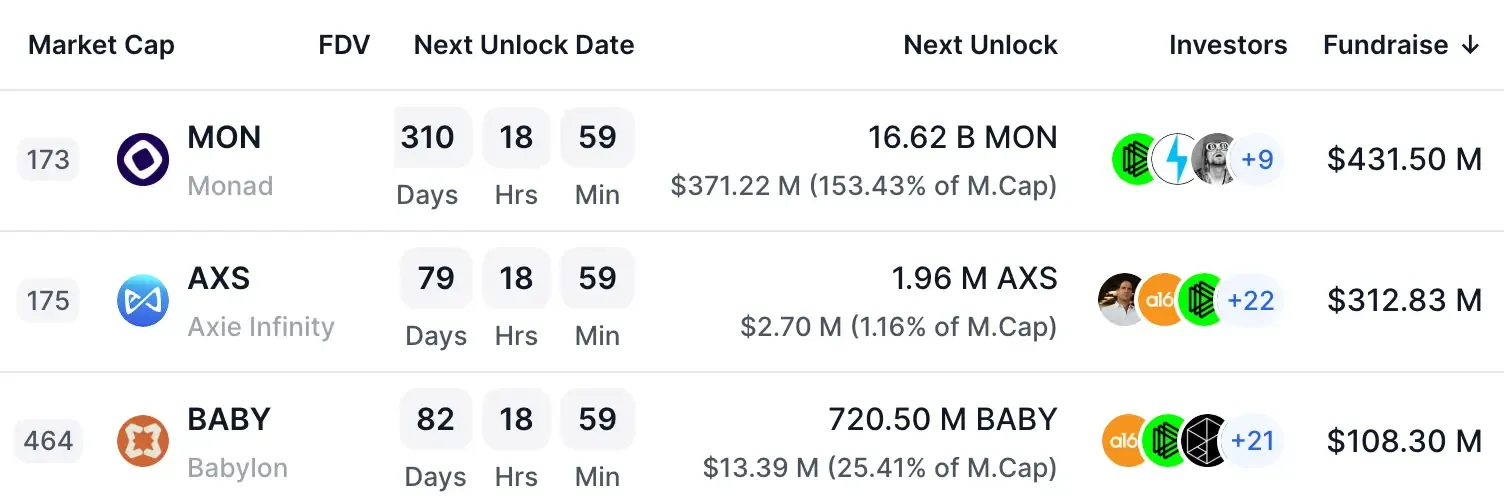
Investor, Fundraise Columns. Provide quick context on who holds supply and how much capital entered early — useful when cross-checking recipient risk.
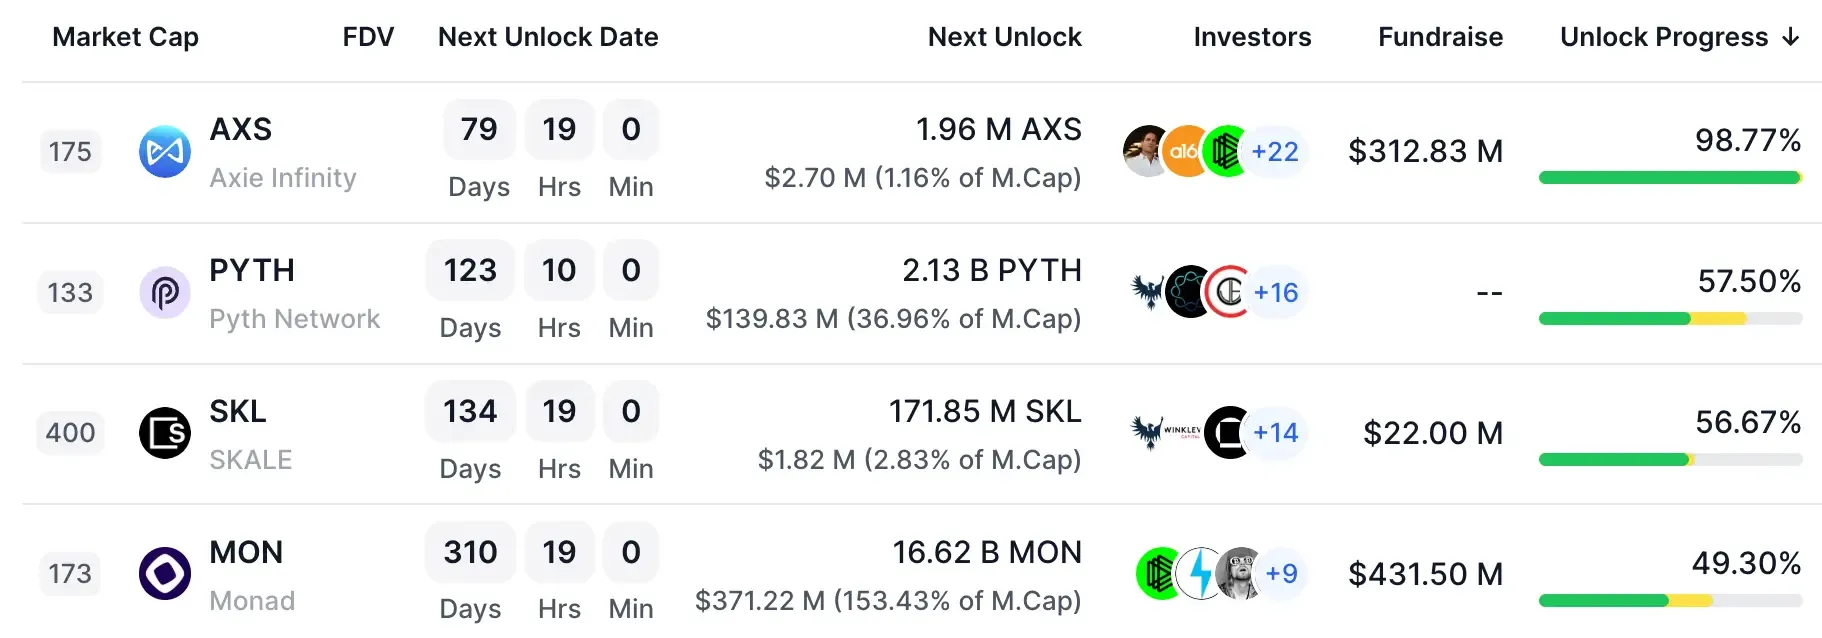
Unlock Progress. Shows how much of the total supply is already unlocked. Higher progress generally means less future dilution remaining.
How Traders Use Token Unlock Tabs in Practice
Traders use this table as a supply risk filter before entering a trade.
Assets shown here have no major unlocks ahead, meaning no near-term dilution pressure. Before buying anything, traders check this view to avoid entering days before a scheduled unlock.
Columns can be customized — investors, fundraising, unlock progress, VWAP — so supply risk is compared alongside other metrics in one table, not in isolation.
If the table is clean and vesting bars are light, supply risk is low. If either looks heavy, position size gets reduced or the trade is skipped.
This view doesn’t predict price. It answers one question first: Is new supply about to hit the market — or not?
Cliff Token Unlocks
Cliff unlocks are where supply mechanics turn into a timetable. They happen on fixed dates, release large chunks of tokens at once, and—unlike most crypto narratives—follow the same pattern again and again.
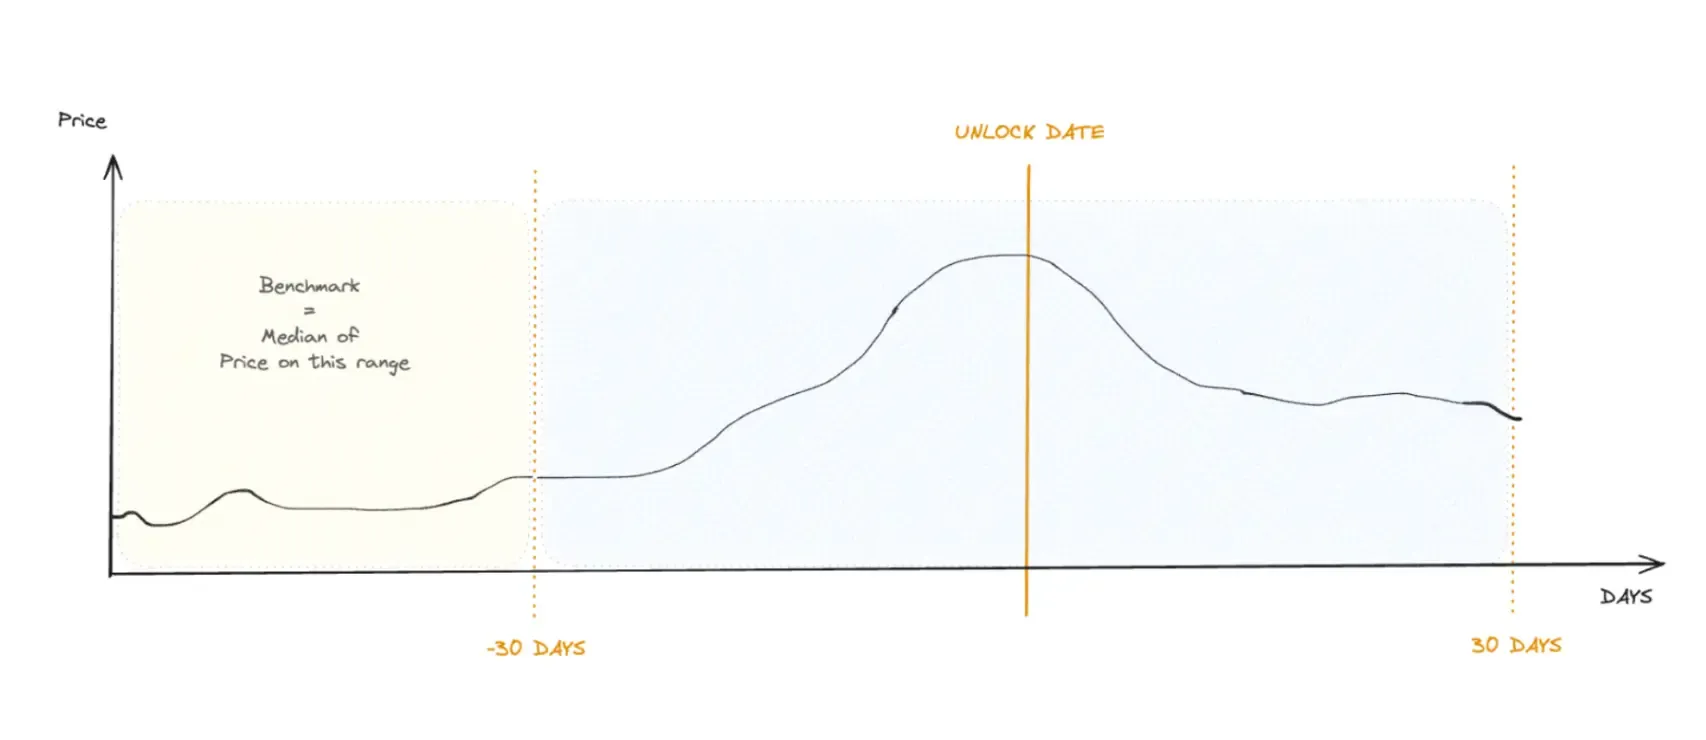
Typical price behavior around large cliff unlocks: positioning begins weeks before the event, volatility peaks near the unlock date, and stabilization follows once supply is absorbed.
Weakness usually starts about 30 days before the cliff. Selling accelerates in the final week. Volatility peaks around the unlock date. Then, once the event passes and positions reset, price often stabilizes and begins recovering roughly 10–14 days later. Not every time—but often enough to plan around.
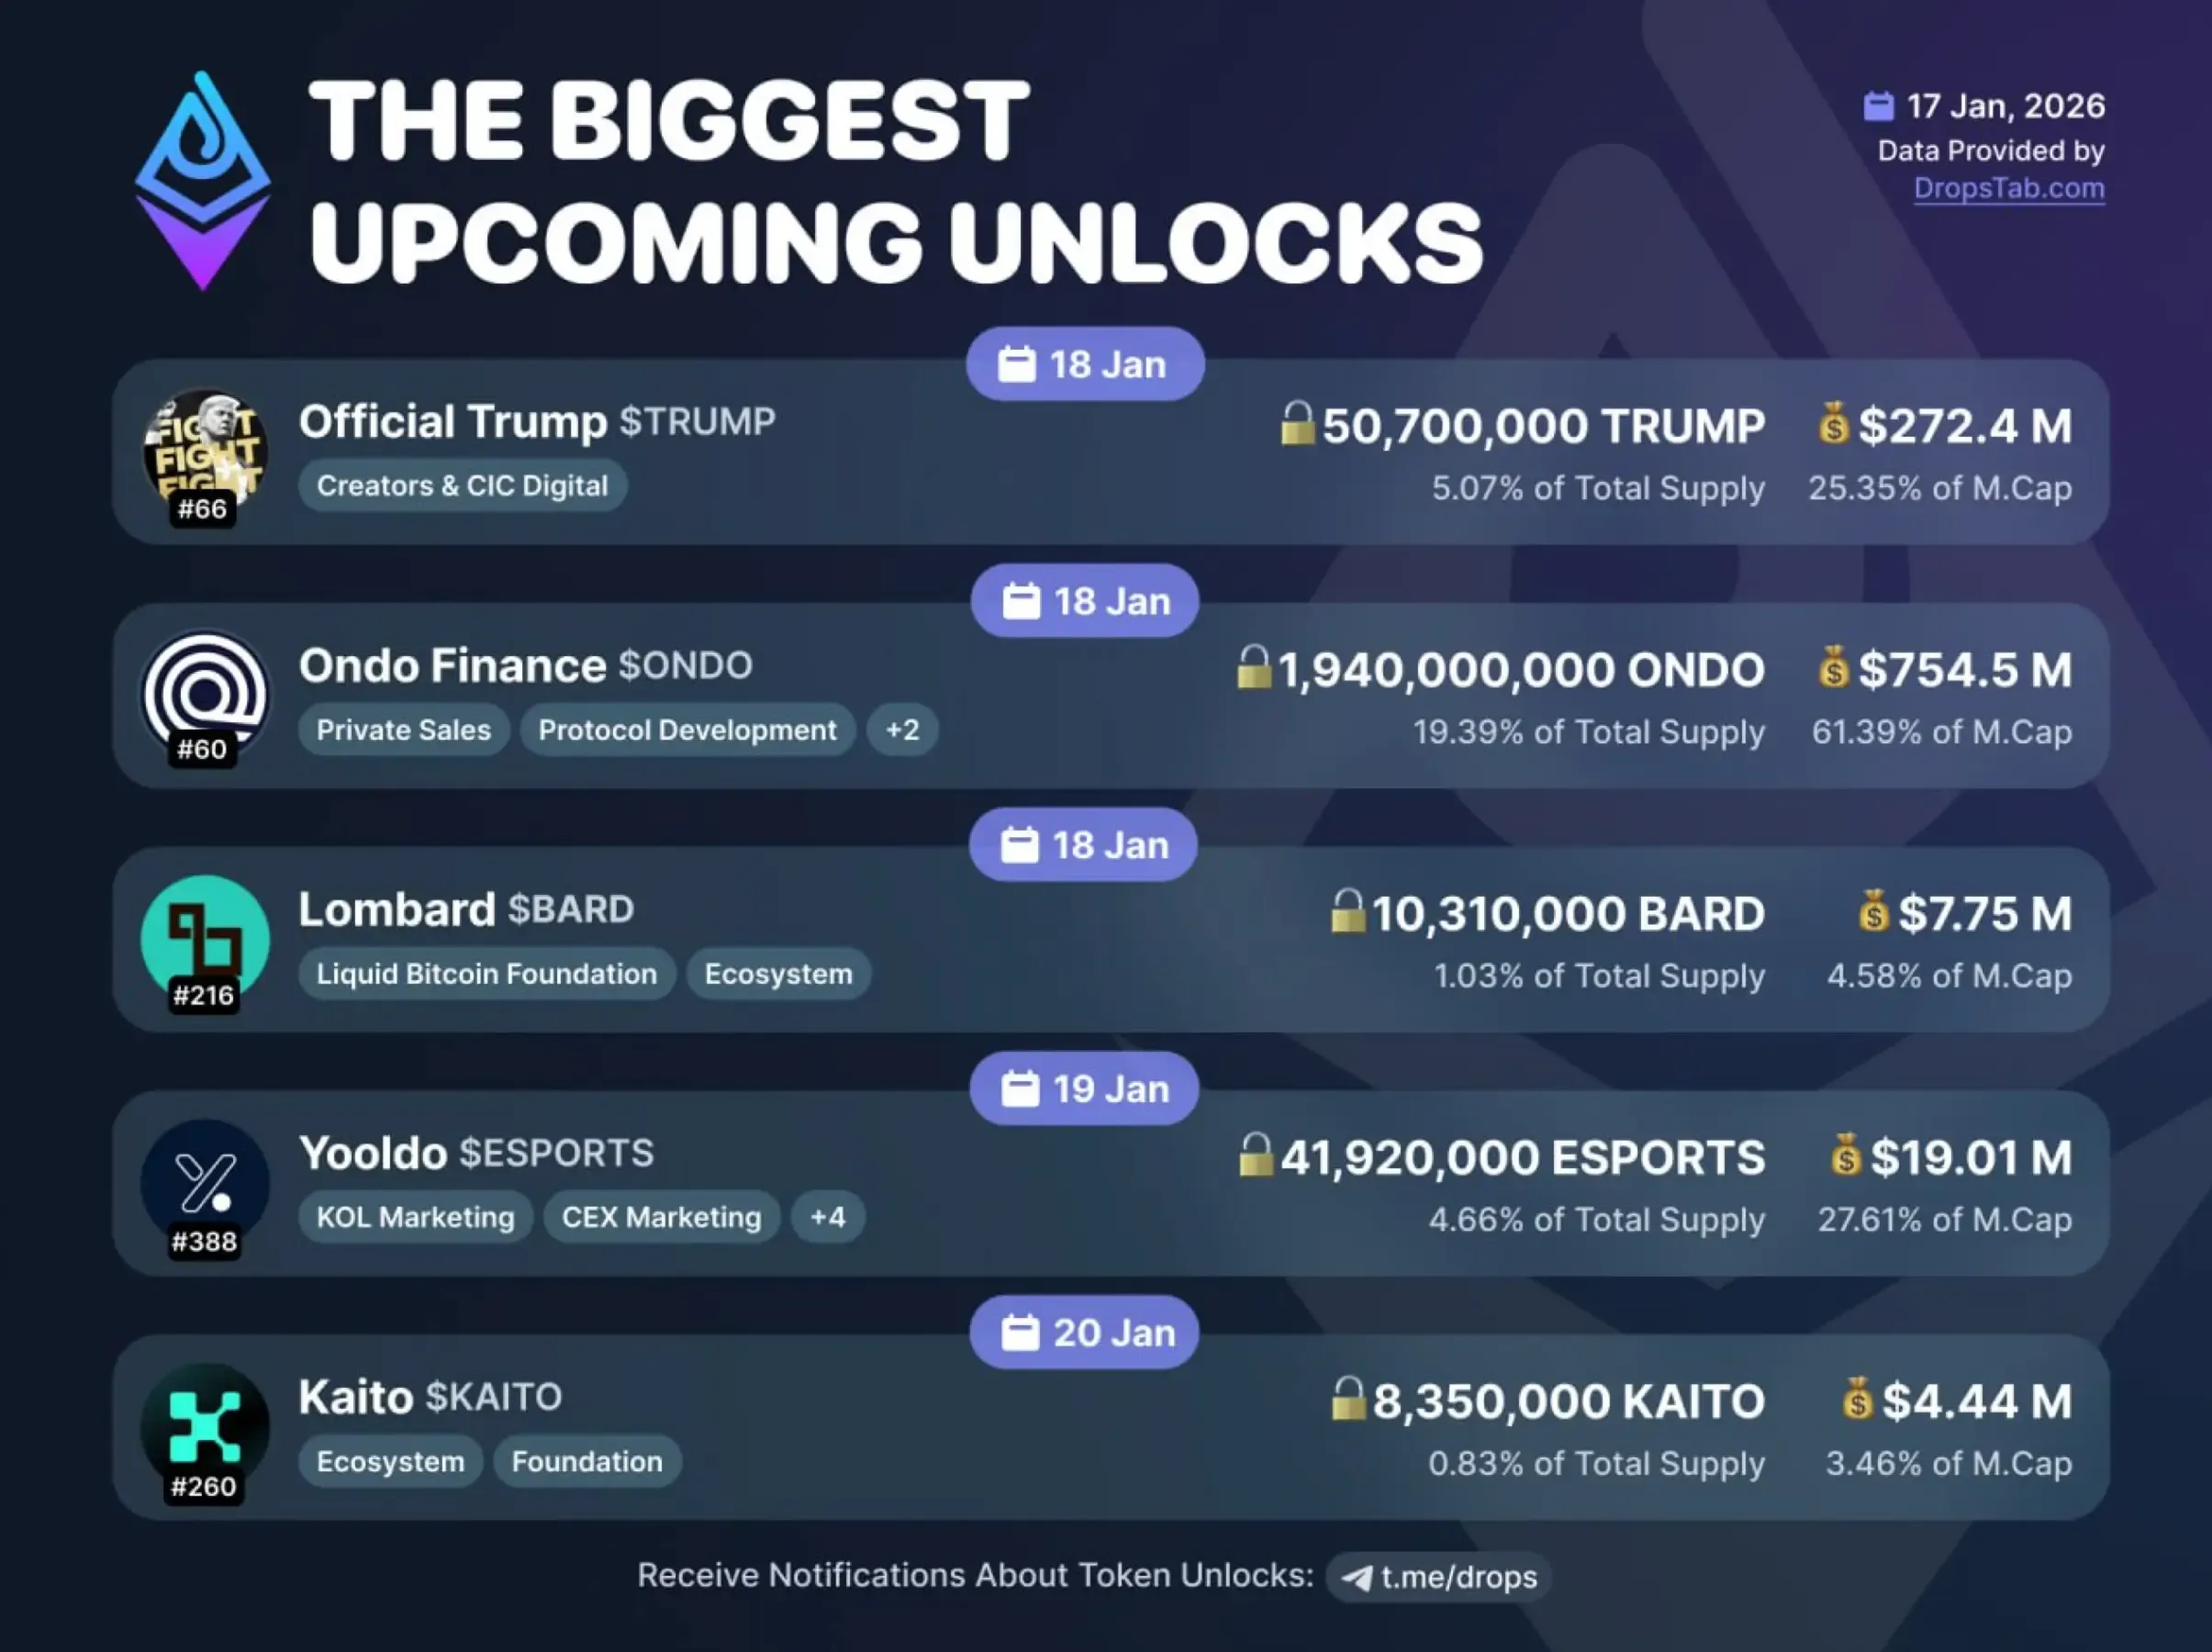
This positioning effect becomes even clearer when you zoom out and look at unlocks in aggregate. In January, several high-profile tokens face large, closely clustered unlocks within the same week—creating overlapping supply events that professional desks hedge well before the calendar date, not on the unlock itself.
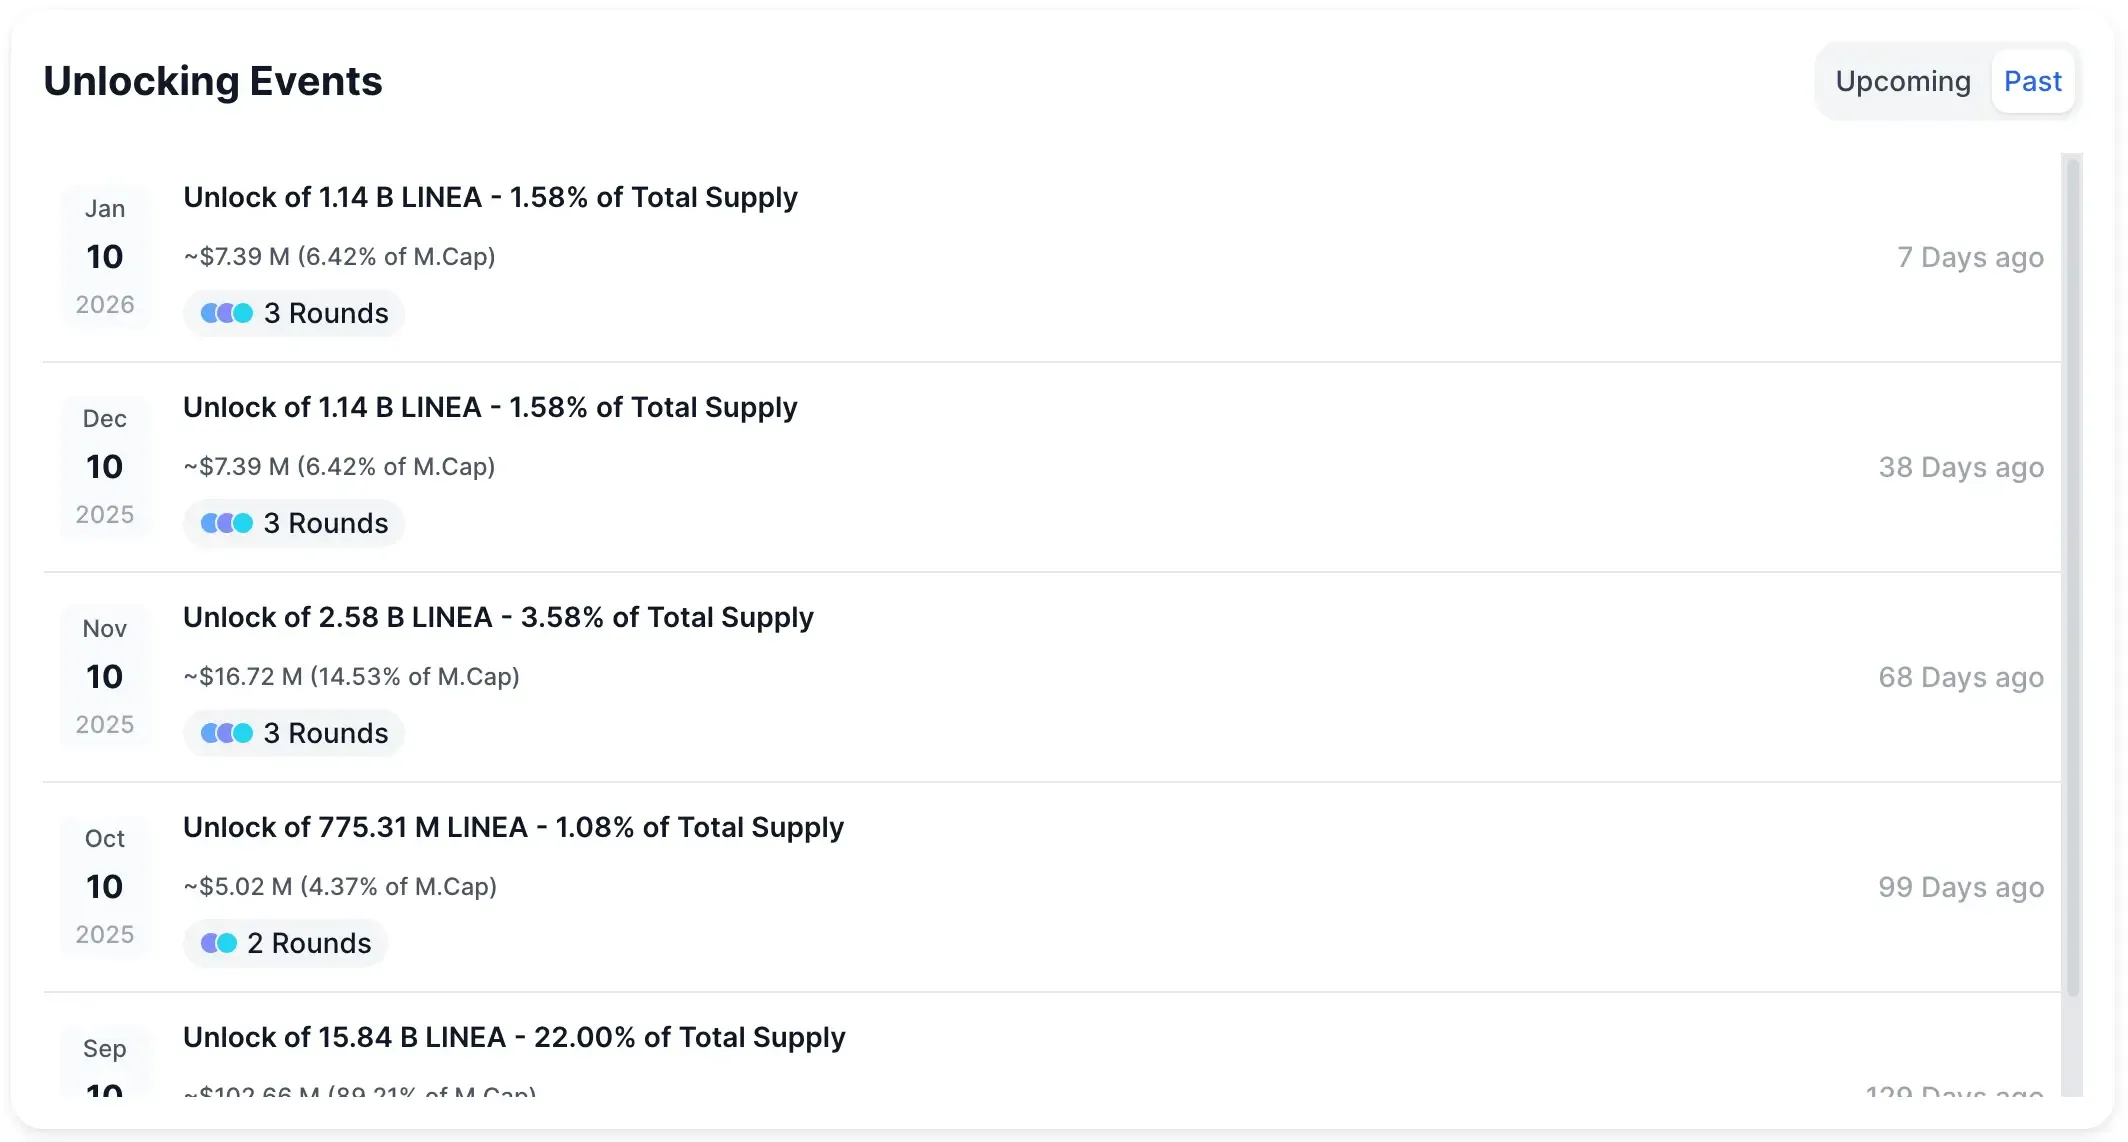
A clean example was $LINEA token unlocks. Its November 2025 cliff unlocked roughly 3,58% of supply on a single date. Price weakened well ahead of the event, and traders positioned early captured most of the move. Those who waited for the unlock itself were late.
Absorption Ratio (Unlock vs Liquidity)
This is the metric most retail traders never calculate—and most institutional desks obsess over. One question only: can the market absorb this supply without breaking? Charts won’t answer that. Liquidity will.
The Absorption Ratio is simple: Absorption Ratio = Unlock Dollar Value ÷ Average Daily Trading Volume.
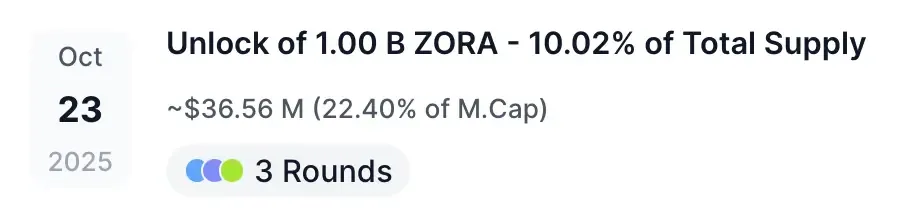
One clean example — Zora unlock (October 23, 2025). Unlock value: ~$36M (1B tokens × ~$0.09)
Daily trading volume: ~$90M
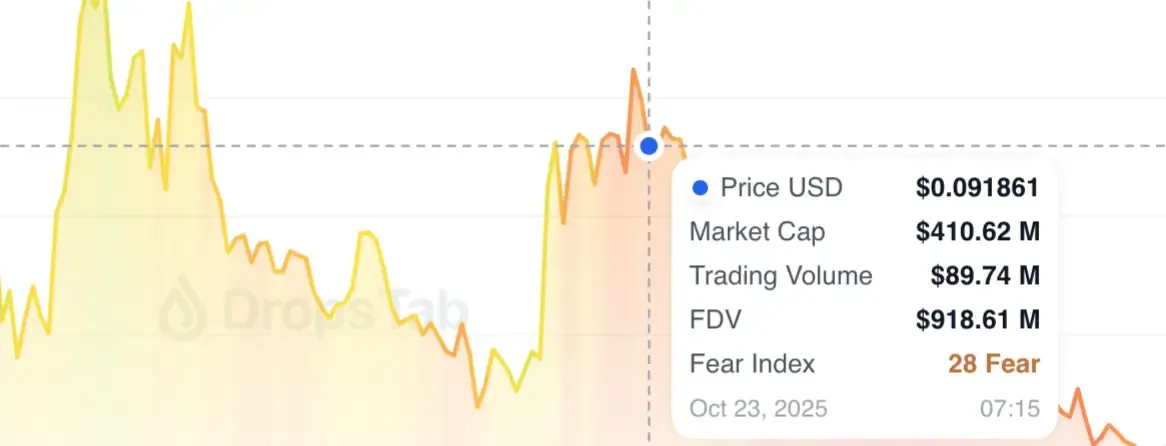
Absorption ratio: ~40% ($36M / 90M trading volume = 0.4)
Outcome: price peaked before the unlock, then trended lower into and after the event, with selling pressure persisting rather than a sharp rebound—consistent with gradual absorption rather than a clean post-unlock reset.
That’s the entire point. The ratio.
<10% of daily volume — The market usually shrugs it off. No trade.
10–50% — Unlocks start to matter. Expect volatility; timing becomes important.
>50% — High-risk zone. Liquidity thins, moves get sharp, and positioning can unwind violently.
DropsTab overlays upcoming unlock size directly against real trading volume, so you can see—before the event—whether an unlock is background noise or a genuine stress test for liquidity. Track that, and the trade usually explains itself.
Token Allocation and Unlock Risk
Not all unlocks behave the same. Identical size. Identical date. Completely different outcomes—based on who receives the tokens.
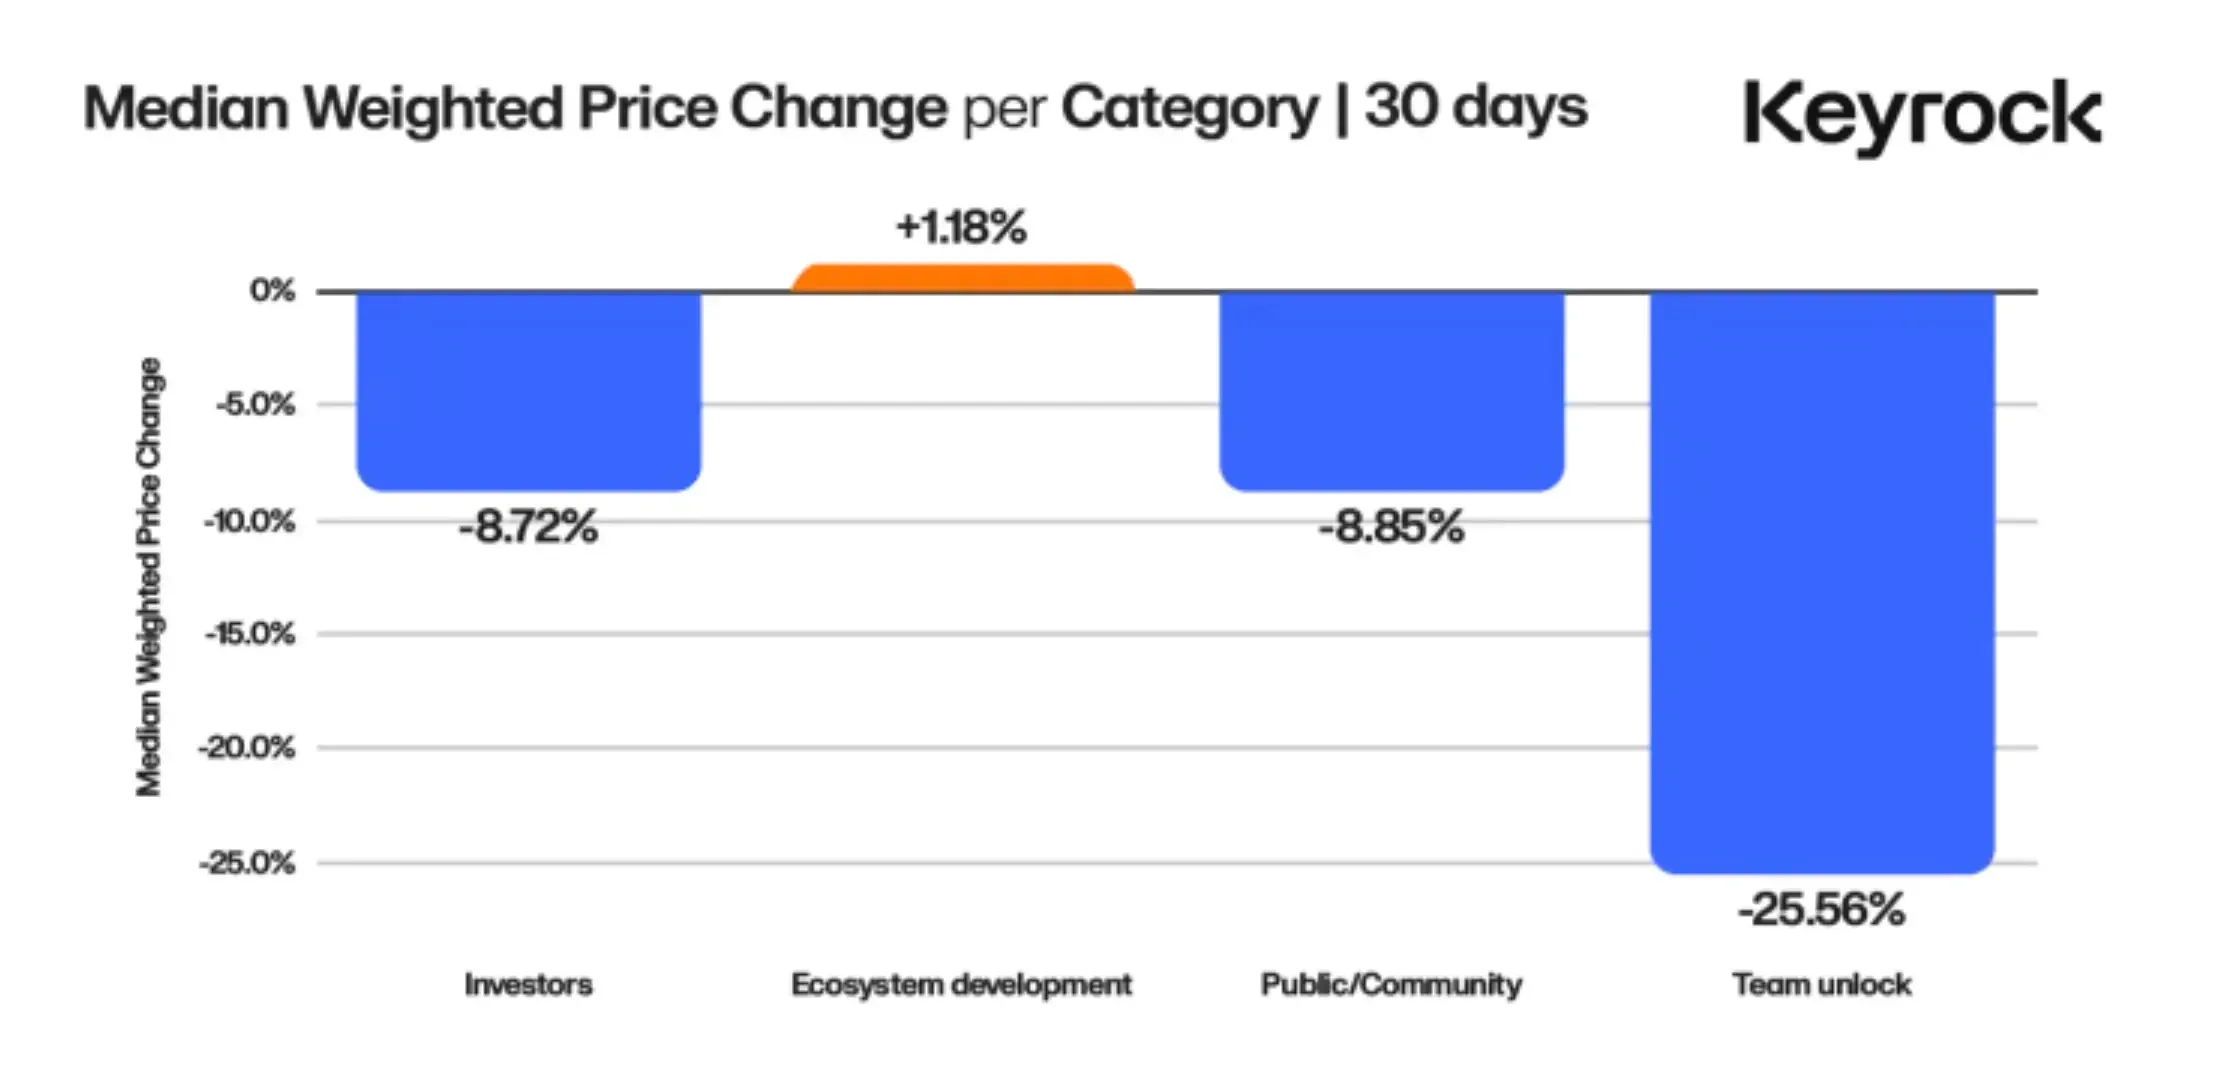
Keyrock’s analysis of 16,000+ unlock events makes this clear. Price reaction isn’t driven by supply alone; recipient type is often the deciding factor.
Average outcomes by allocation:
- Team / Founder: ~−25% (worst performer)
- Early Investors / VCs: −15% to −20%
- Community / Public: −8% to −10%
- Ecosystem / Development: ~+1%
- Liquidity / Staking Rewards: typically neutral
How DropsTab Visualizes Token Recipient Risk
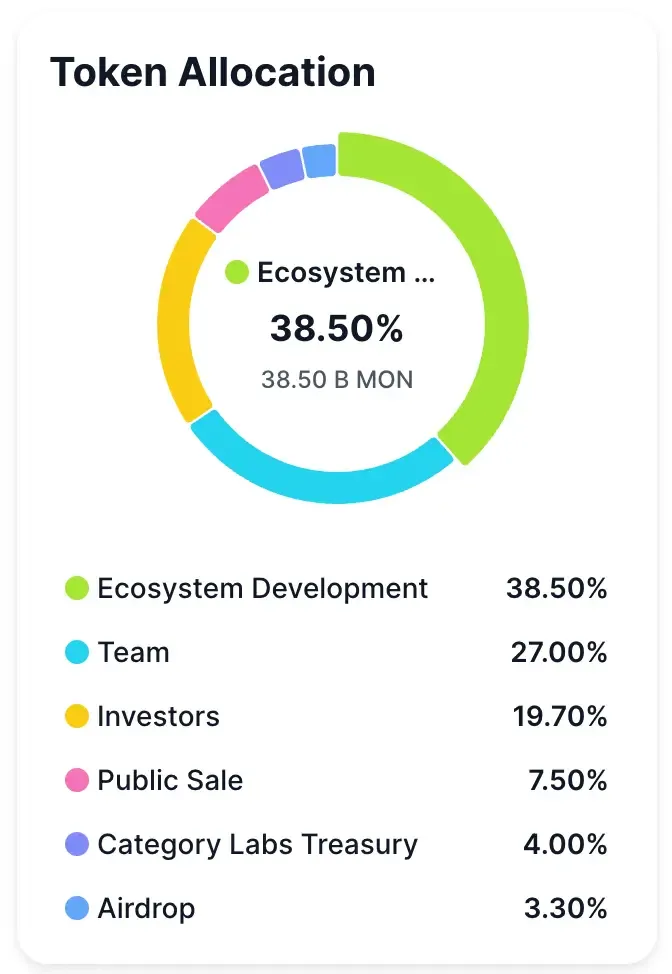
DropsTab visualizes recipient types directly in the vesting chart, removing the need to parse tokenomics PDFs. A clear example is Monad (MON) token allocation:
- Turquoise — Team / founders (high risk; avoid holding into these unlocks)
- Yellow — Investors / VCs (still risky; de-risk early)
- Green — Ecosystem / development (neutral; check adoption metrics)
- Pink, Blue — Community / rewards (mixed; sentiment-dependent)
The upcoming unlock is concentrated almost entirely in investor and team allocations. In ~311 days, roughly 4.93B MON (≈4.9% of total supply) unlocks to investors and 10.69B MON (≈10.7% of total supply) unlocks to the team. Together, that’s ~15.6% of total supply becoming tradable in a narrow window.
By contrast, airdrop, public sale, and ecosystem allocations are already 100% unlocked and no longer represent future sell pressure.
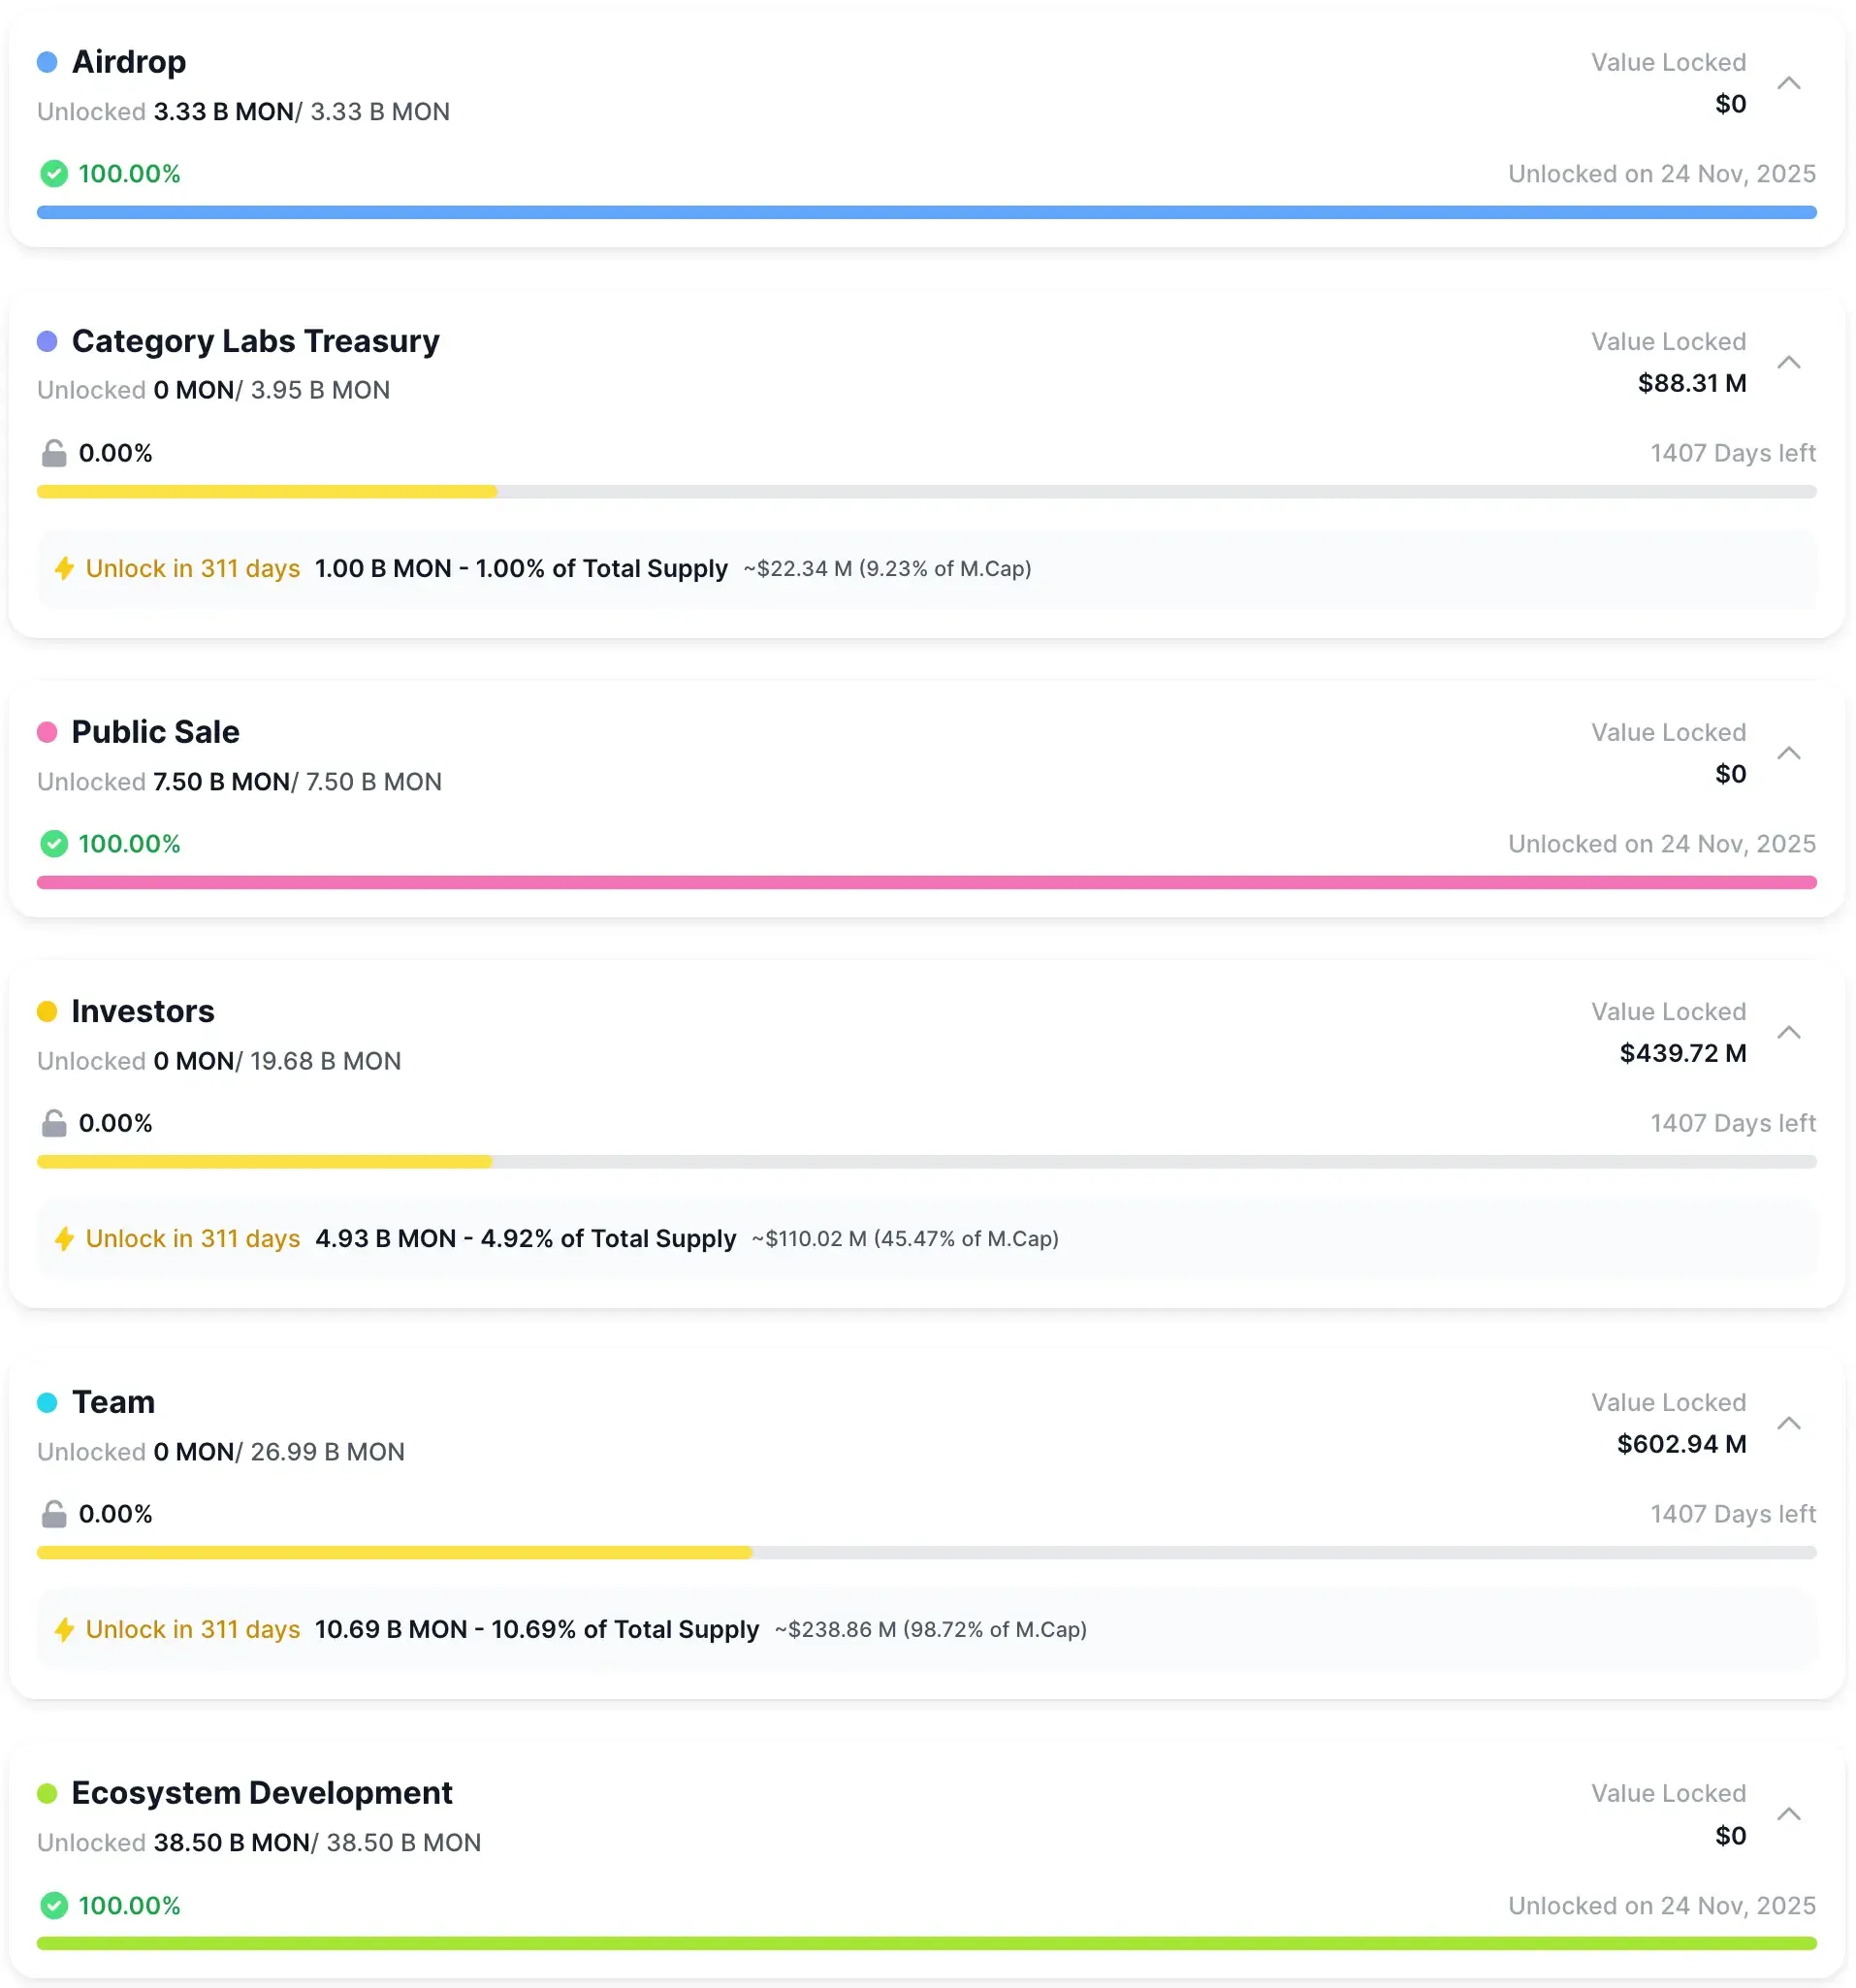
That distinction matters. Investor and team unlocks are historically the most sell-prone categories, and the scale here is large relative to current market cap. Even without any negative news, this kind of supply event creates structural pressure that the market must absorb.
So, the unlock size tells you how much supply is coming. The recipient breakdown tells you how likely that supply is to sell.
Conclusion
Before any trade, the same questions matter every time:
- How much supply is coming?
- When does it unlock?
- Who receives it?
- Can the market absorb it?
DropsTab turns those questions into a visible checklist. Unlock size relative to circulating supply tells you whether an event is noise or material. The absorption ratio shows whether liquidity can realistically handle it. Recipient type clarifies whether unlocked tokens are likely to sell. Vesting progress and MC/FDV reveal how much dilution still lies ahead.
When these signals line up negatively, the trade isn’t “early” — it’s structurally disadvantaged. When they line up clean, price gets to move on demand rather than dilution.
Price often looks emotional.
Supply never is.
Read the supply — and most trades explain themselves.