Product
Mastering Crypto Trading with DropsTab’s VWAP Radar
VWAP Radar shows how far a token’s price is from its volume-weighted fair value, turning complex price-volume data into an easy score that instantly reveals overheated markets or bargain opportunities.
Quick Overview
- VWAP = Fair Value – Shows the price where most trading occurred; VWAP Radar measures how far a token’s price is from that baseline.
- VWAP Score – High scores (≈+100) mean overheated markets, low scores (≈–90) mean deep discounts.
- Actionable Trading Signals – Buy at extreme negative scores, sell or short at extreme positive scores, or use zero-crossovers for trend shifts.
- Multi-Timeframe View – Compare short- and long-term scores to confirm setups.
- Market-Wide Scanner – Real-time dashboard for spotting mispriced tokens without checking charts one by one.
- Plays Well with Other Tools – Combines with RSI, moving averages, and on-chain metrics for stronger trade confirmation.
Why VWAP Matters in Crypto Trading
Volume-Weighted Average Price (VWAP) is the average price an asset trades at, adjusted for how much volume was traded at each price. In simple terms, it’s the price most traders actually paid. Prices with more trades have more influence on the average.
Formula: VWAP = (Σ(Price × Volume)) ÷ (Σ Volume)
If you’re new to DropsTab, our beginner’s guide explains how the platform turns raw data into real trading context — helping you read markets through investor activity, unlock cycles, and accumulation trends rather than price alone.
VWAP is used as a fair value marker. If the price is below VWAP, it might be a bargain; if it’s above, it could be overpriced. Big traders often aim to buy below VWAP to get a better deal.
In traditional markets, VWAP resets every day and helps traders see if the trend is up (price above VWAP) or down (price below VWAP). In crypto, which trades 24/7, VWAP can be set for longer periods—like a week or a month—making it more flexible. DropsTab’s VWAP Radar uses custom timeframes like 7 days or 3 months to spot trends.
In crypto, VWAP works like a truth check for price. When the price is way above VWAP, it often falls back down; when it’s far below, it often bounces back. This makes VWAP a valuable tool for avoiding buying into hype or selling in panic.
Introducing VWAP Score and DropsTab’s VWAP Radar
DropsTab’s VWAP Radar shows how much a token’s price differs from its volume-weighted average price (VWAP). The VWAP Score turns this difference into a percentage:
VWAP Score = ((Current Price – VWAP) / VWAP) × 100
How to read it
A score of 0 means the price equals VWAP — fair value.
Positive scores mean the price is above VWAP. +50 to +99 = Overvalued, and +100 or higher = Overheated (extremely above average).
Negative scores mean the price is below VWAP. –50 to –99 = Undervalued, and –100 = Oversold (significantly below average).
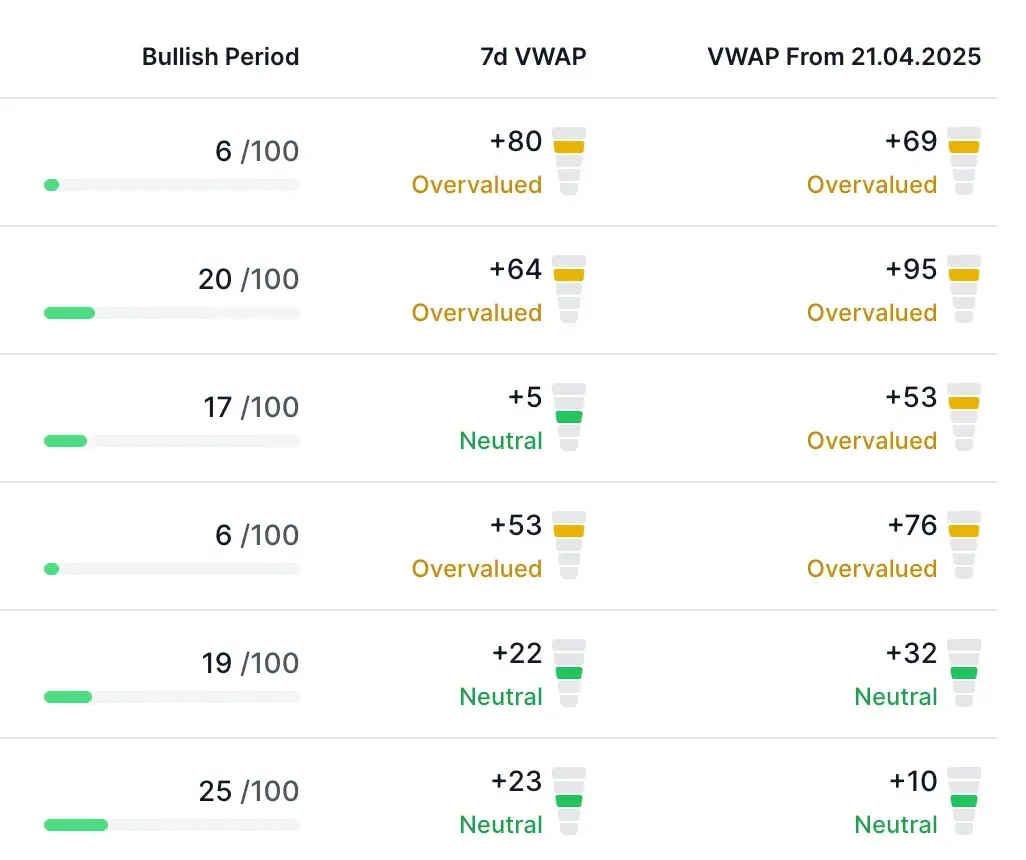
Scores are capped at ±100. VWAP Radar displays both short-term (e.g., 7-day) and long-term (e.g., 3-month) scores so traders can compare trends.
Examples
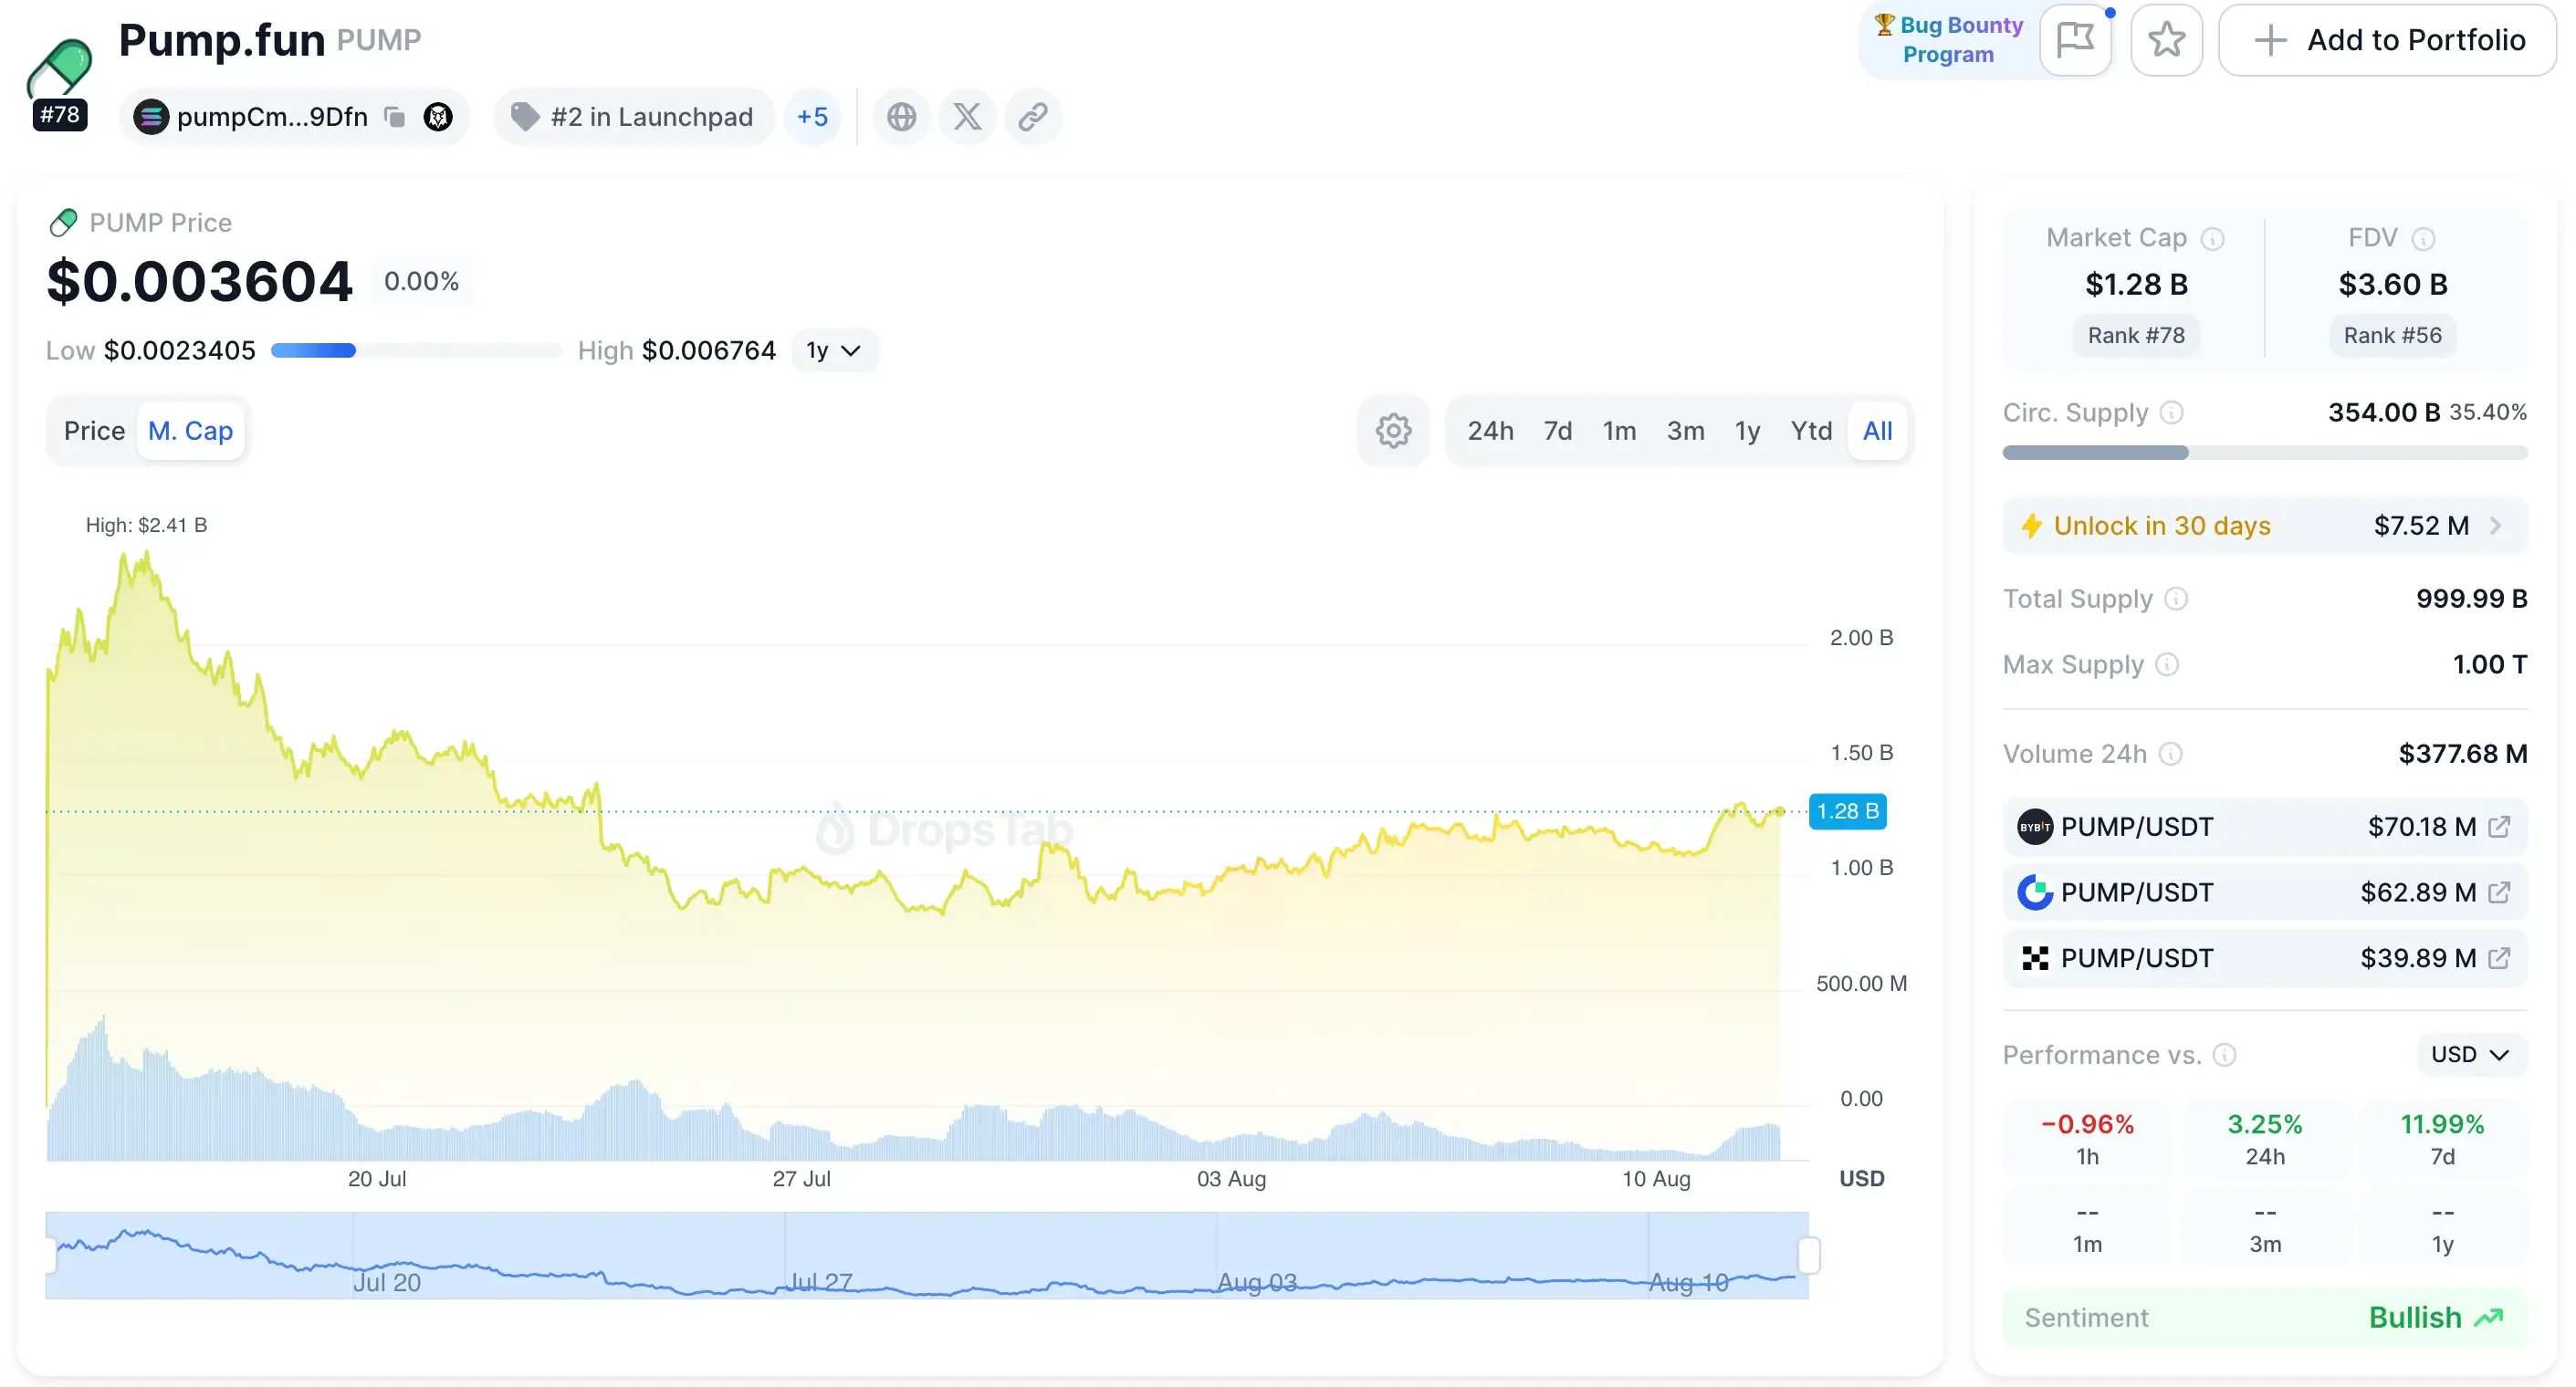
PUMP token: 7d = ≥+100 (Overheated), 3mo = –14 (Neutral) → Strong short-term hype.
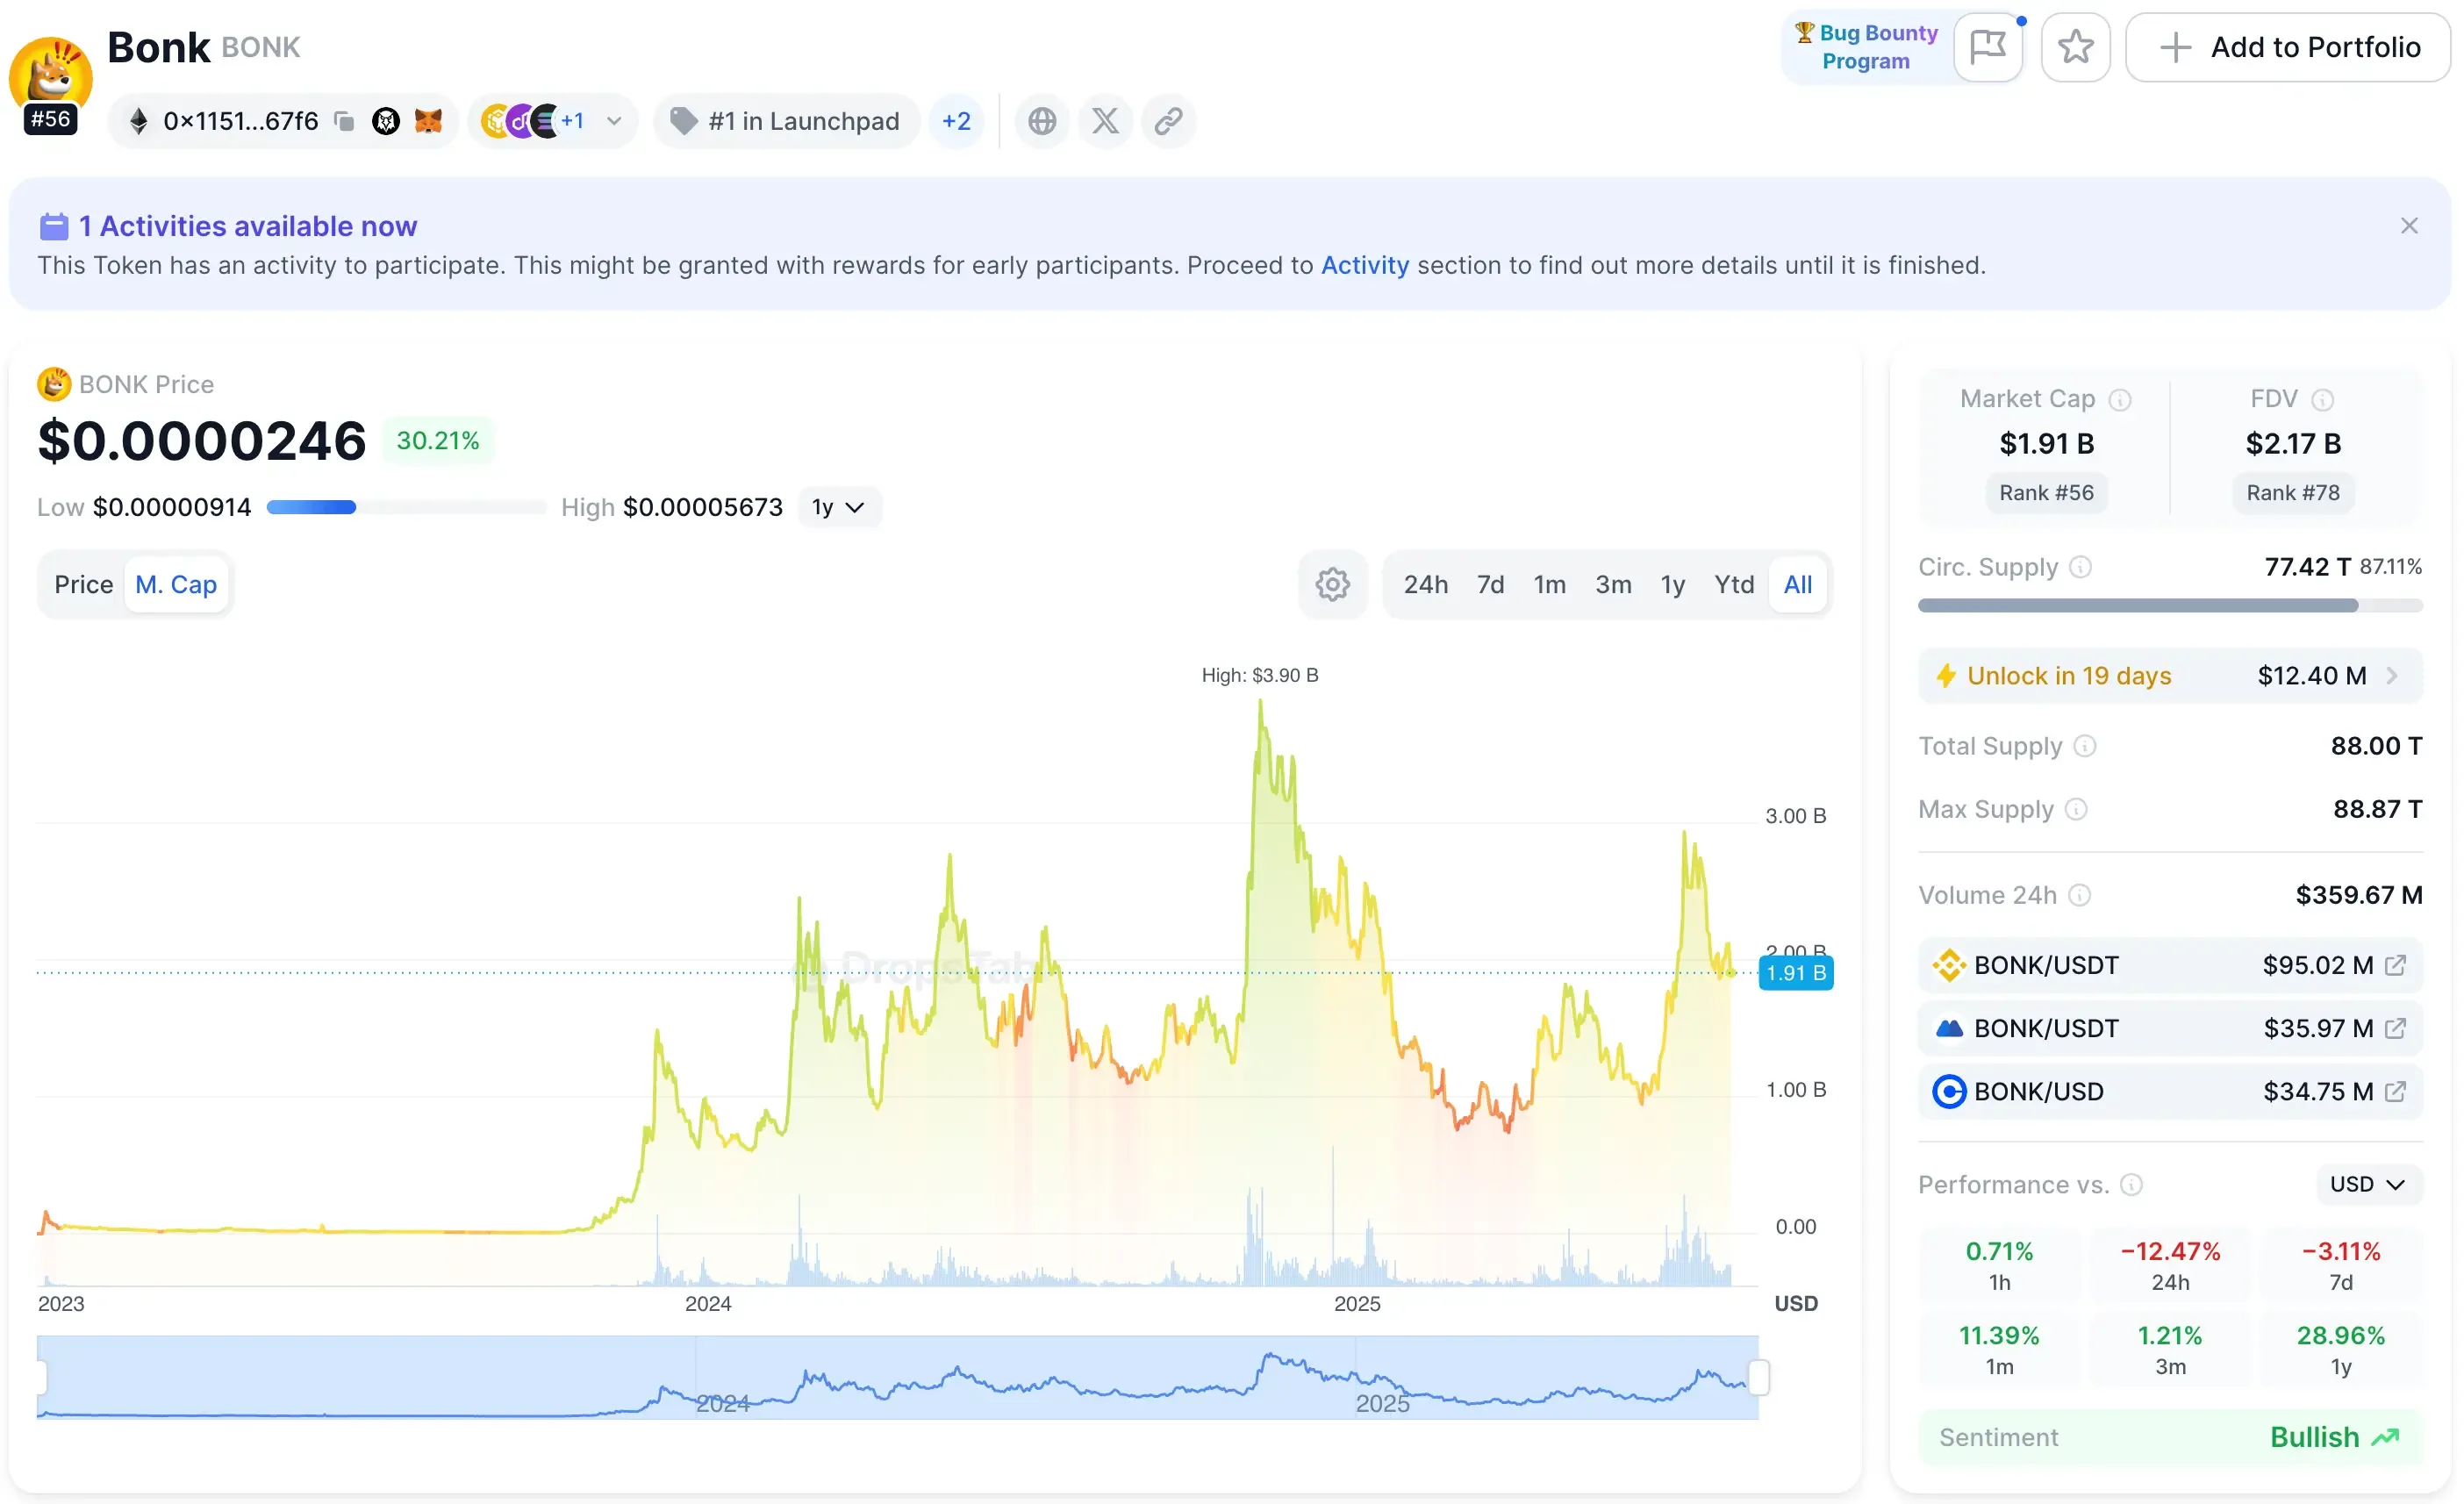
BONK token: 7d = –89 (Deep Discount), 3mo = +8 (Neutral) → Heavy short-term sell-off, possible rebound.
VWAP Radar helps traders quickly find overheated or undervalued tokens by tracking both price and trading volume.
Spotting Fair Prices, Hype, and Bargains Using VWAP Radar
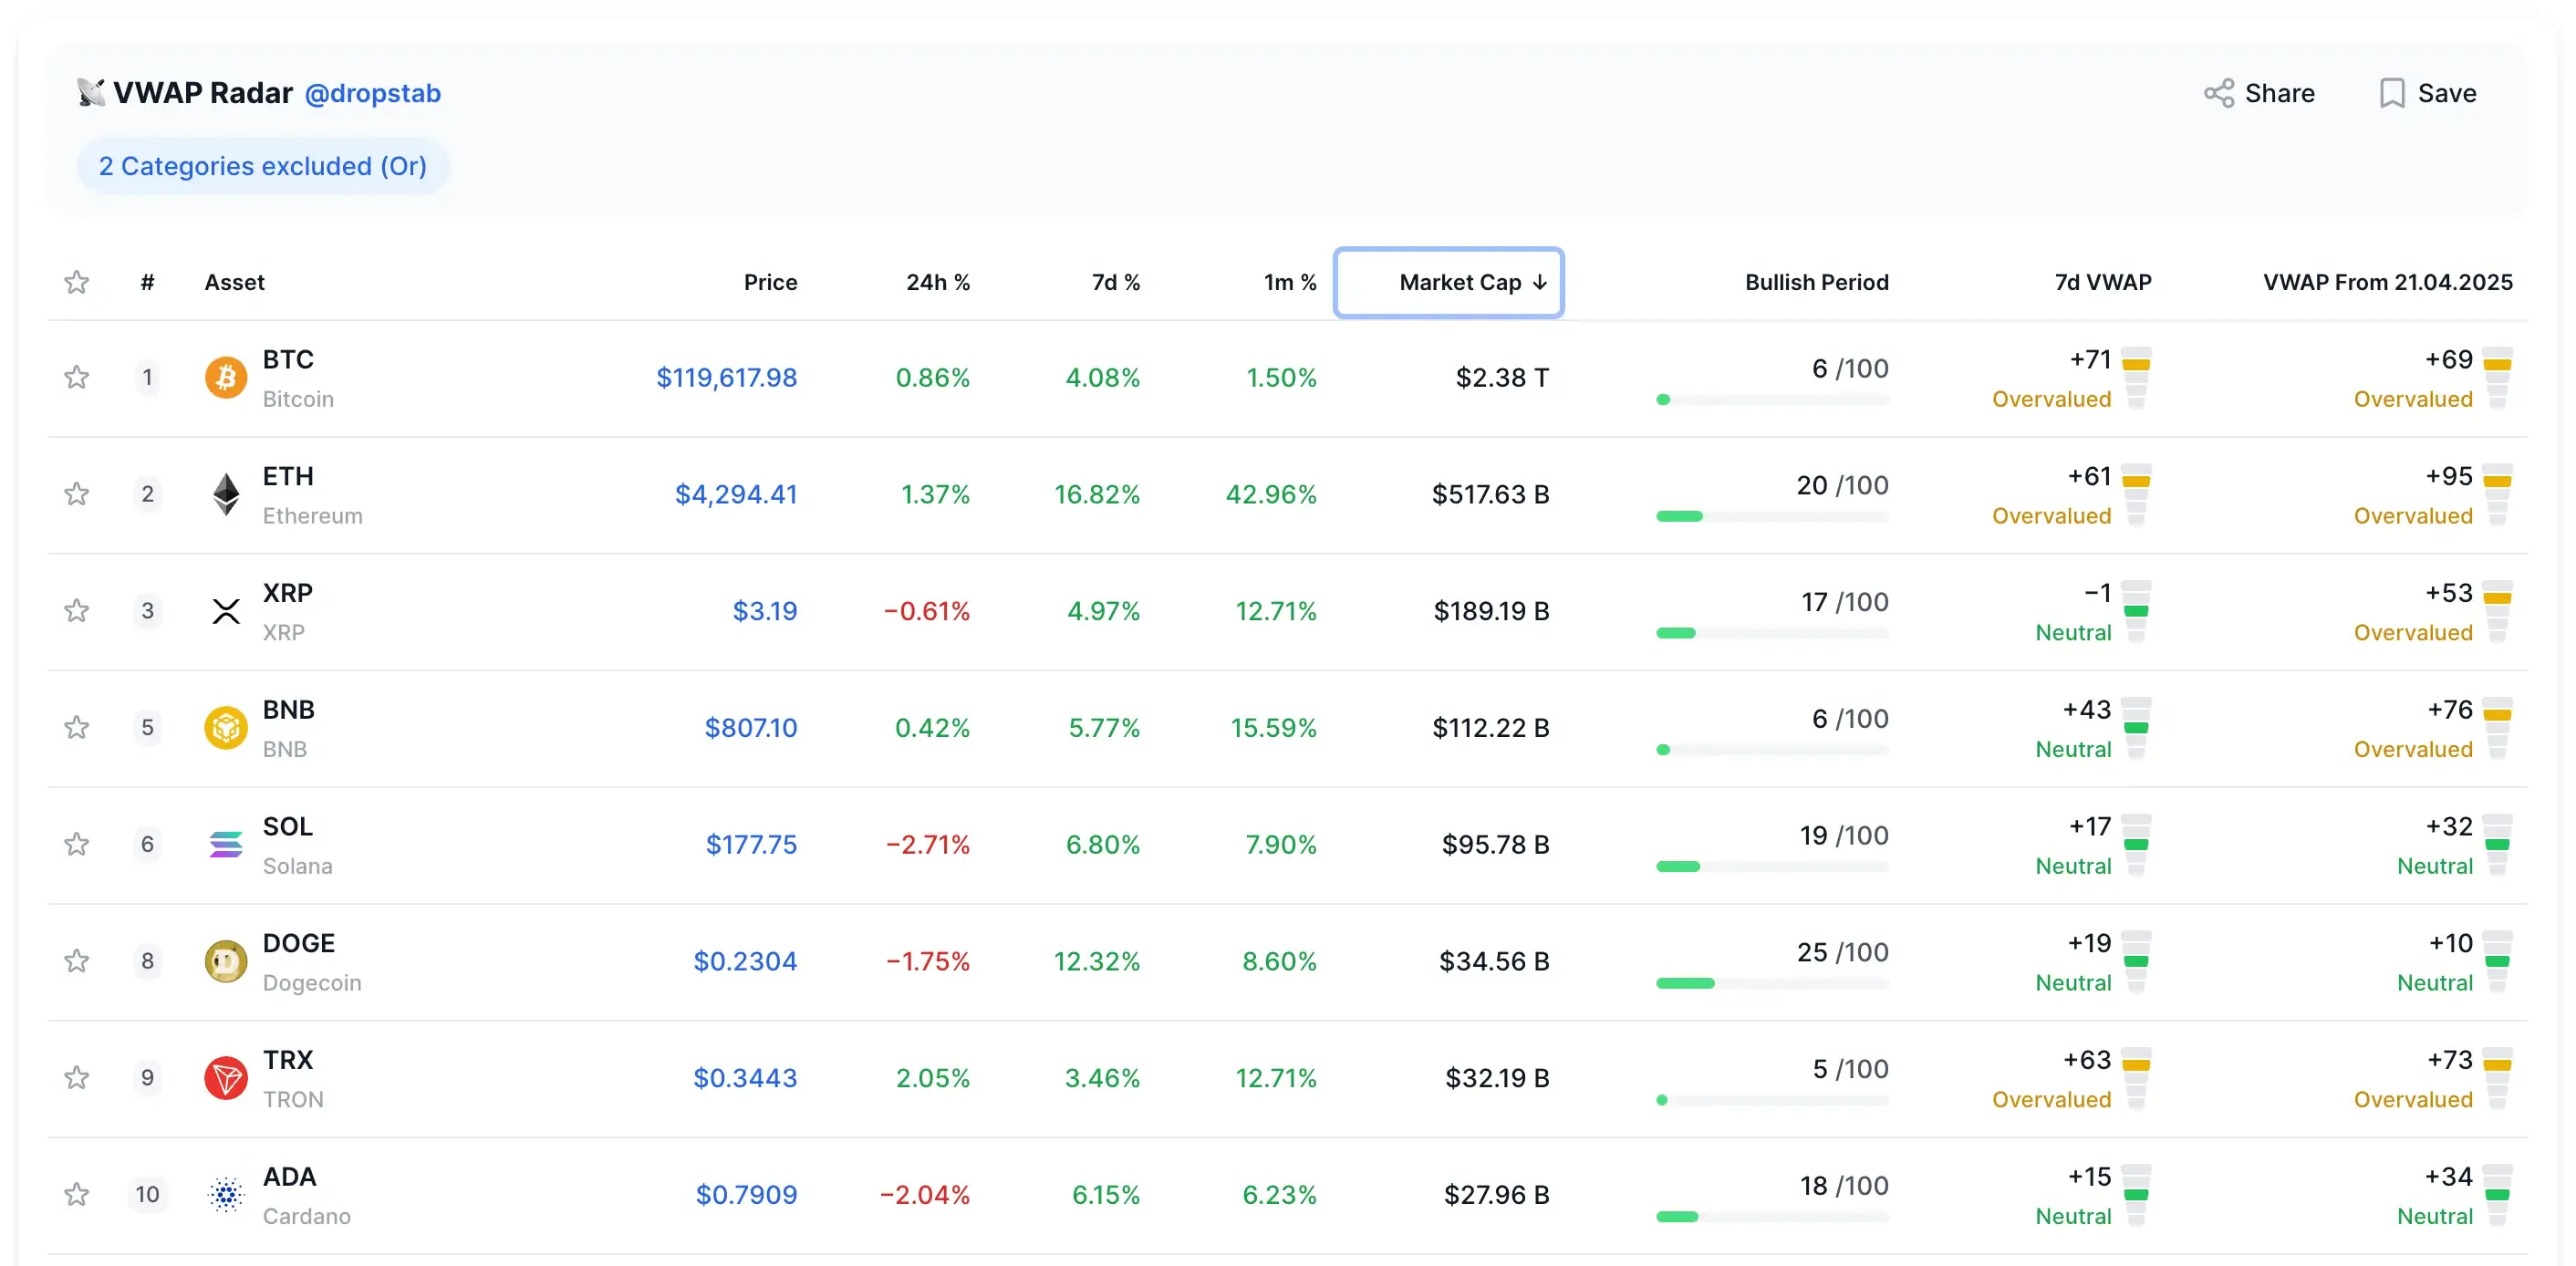
Fair Value Zone (VWAP Score ~ –50 to +50)
When the score is near zero, the price is close to its VWAP — considered fair value. Example: Ethereum at +5 on the 30-day VWAP is just 5% above average, marked Neutral. No clear buy or sell pressure.
Overheated Zone (High Positive Score)
A score above +50 means the price is high compared to VWAP; +100 means it’s double (Overheated). This often happens during short-lived rallies. Example: In July 2025, PUMP hit +100 weekly and then dropped soon after. Traders may take profits or set tight stops in this zone.
Discount/Oversold Zone (High Negative Score)
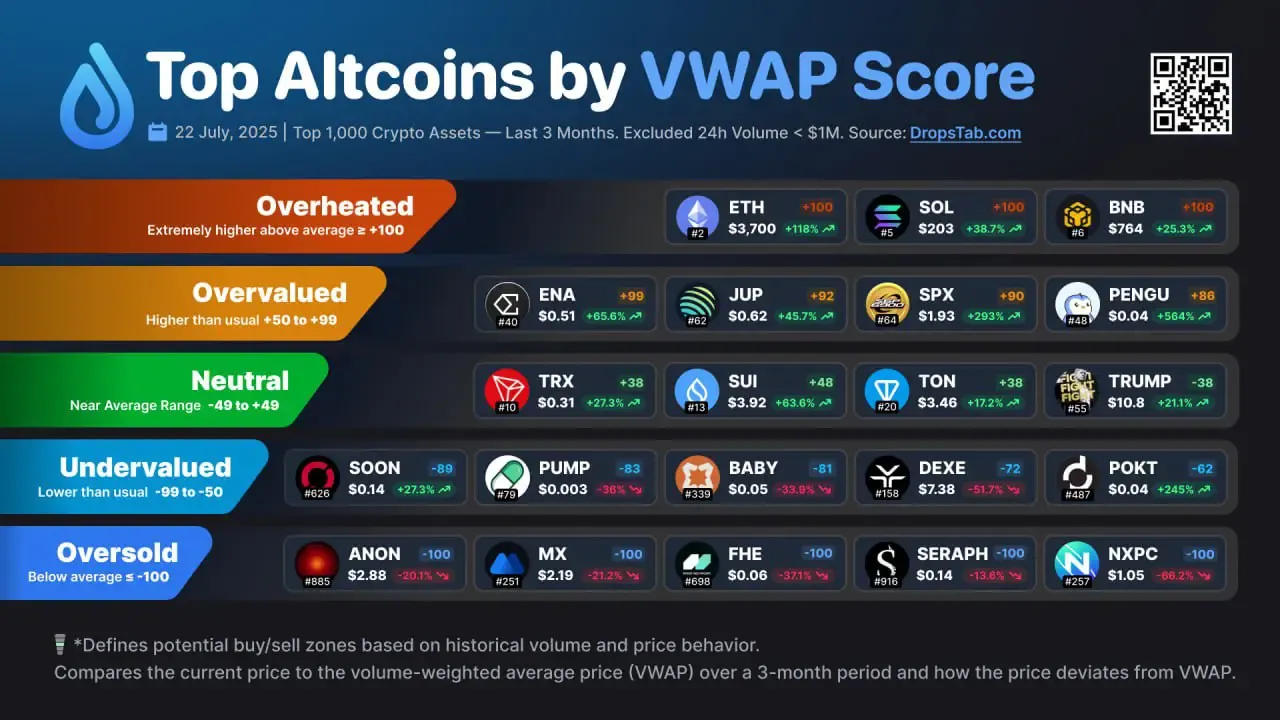
A score below –50 means undervalued; –90 is a Deep Discount. This often appears during panic selling. Example: BONK at –89 weekly showed heavy selling, then bounced back. The table below highlights newly launched coins with the deepest 3-month VWAP Score discounts, including REX and NXPC at –100, signaling extreme oversold conditions.

Mixed Signals
Short- and long-term scores can show different stories. Example: EGL1 had –72 weekly (short-term undervalued) but +68 on 3-month (still expensive). This suggests a short-term bounce is possible, but long-term it remains pricey.
Summary
VWAP Radar’s color codes (Neutral, Undervalued, Overheated) help traders quickly see if prices are balanced or extreme. The VWAP Score adds volume context, showing how far a token’s price is from fair value and helping spot hype or real bargains. The heatmap below illustrates these categories in action, showing top altcoins ranked by their 3-month VWAP Score — from overheated leaders like ETH, SOL, and BNB at +100 to deeply oversold tokens such as NXPC, SERAPH, and ANON at –100.
Trading Strategies Using VWAP Radar
1. Contrarian “Buy Low, Sell High”
VWAP Score can show when prices might swing back toward fair value.
- Buy when cheap: Scores under –60 mean heavy selling. Example: A coin at –80 after a drop might bounce back.
- Sell when hot: Scores over +50, and especially near +100, often mean prices are overheated. Example: A meme coin at +110 fell within two days. Simple rule: buy below –70, sell above +80, but confirm with charts or volume.
2. Trend-Following “VWAP Crossover”
Watch for the score to cross zero.
- Bullish: Negative to positive = buyers gaining control. Example: XRP going from –10 to +10 on high volume.
- Bearish: Positive to negative = sellers taking over. Example: ETH dropping from +15 to –5 in a sell-off. VWAP can act as a moving support or resistance. Use it for stop-losses.
3. Multi-Timeframe Check
Compare short- and long-term scores.
- Both oversold: Stronger buy case.
- Both overheated: Bigger correction risk. Example: –60 (7d) and –20 (3mo) = possible buy; –80 (7d) and –40 (3mo) = even stronger.
Tip: Combine VWAP Radar with RSI, Bollinger Bands, or other tools. VWAP Score helps find extremes; other indicators fine-tune your entry and exit.
VWAP Radar vs. Other Market Tools
Standard VWAP (e.g., TradingView)
Shows VWAP for one asset at a time and often resets daily. Checking many coins is slow. VWAP Radar puts all tokens’ VWAP differences in one dashboard with scores, so you can spot market extremes fast.
Moving Averages & RSI
These show trend or momentum but ignore trading volume. VWAP Score uses volume to show real value. A coin above its MAs but with a negative VWAP Score may have weak buying power.
On-Chain/Fundamental Metrics
Tools like Glassnode or CryptoQuant track long-term value but may miss quick sentiment changes. VWAP Radar is real-time, showing if prices are above or below recent norms, bridging the gap between fundamentals and price action.
Other Scanners/Signals
Many focus on % change or spikes in volume. VWAP Radar checks price vs. fair value, catching slow drops or undervalued prices after pumps that others miss.
Bottom line
VWAP Radar works with other tools, giving a market-wide, volume-based view to quickly find overpriced or underpriced tokens.
Key Takeaways
VWAP shows the price where most trades happened, and VWAP Radar measures how far today’s price is from that level. A score of 0 means the price is fair, a positive score means it’s expensive, and a negative score means it’s cheap.
VWAP Score turns price and volume into an easy-to-read number. High scores near +100 often mean the market is overheated, while low scores near –90 signal big discounts.
Traders might buy when scores are very negative and sell or short when they’re very positive. A move from negative to positive can point to a new upward trend.
VWAP Radar checks all tokens in real time and shows where prices don’t match recent trading activity, making it easier to spot opportunities quickly.
It works best alongside tools like moving averages, RSI, or on-chain data, adding a volume-based view to avoid false signals and improve timing.
In short, VWAP Radar helps traders steer clear of hype, find real value, and act fast in any market condition.
Try VWAP Radar in action here: https://dropstab.com/tab/vwap