Product
How to Analyze Crypto Fundraising Rounds Using DropsTab?
The cryptocurrency market undergoes continuous structural shifts in how capital is deployed. We break down how to track venture capital flows, analyze fundraising rounds, and leverage DropsTab's powerful data architecture to build actionable investment strategies.
Key Points
- Follow the Smart Money: Tracking venture capital deployment reveals whether the market favors highly speculative protocols or derisked, mature business models.
- Dashboard Mastery: DropsTab simplifies complex venture data with real-time widgets, allowing you to instantly assess macro funding trends and category dominance.
- Asset-Specific Deep Dives: The platform offers highly specific funding tabs for individual coins, allowing you to view a project's entire financial history from Seed to Series C.
- Dilution Matters: Evaluating a token's structural risk requires isolating the mathematical disparity between its circulating Market Capitalization (MC) and its Fully Diluted Valuation (FDV).
- Cross-Referencing: Successful fundamental analysis requires cross-referencing recent capital raises with upcoming token unlock schedules to anticipate supply shocks.
Visualizing the Macro Data on DropsTab
To get the most out of DropsTab as a daily training and research resource, it helps to understand exactly what the platform's real-time widgets are telling us. DropsTab's Funding Rounds surfaces the most critical market movements immediately upon login, transforming a sea of numbers into digestible visual trends.
Last Month Funding Highlights
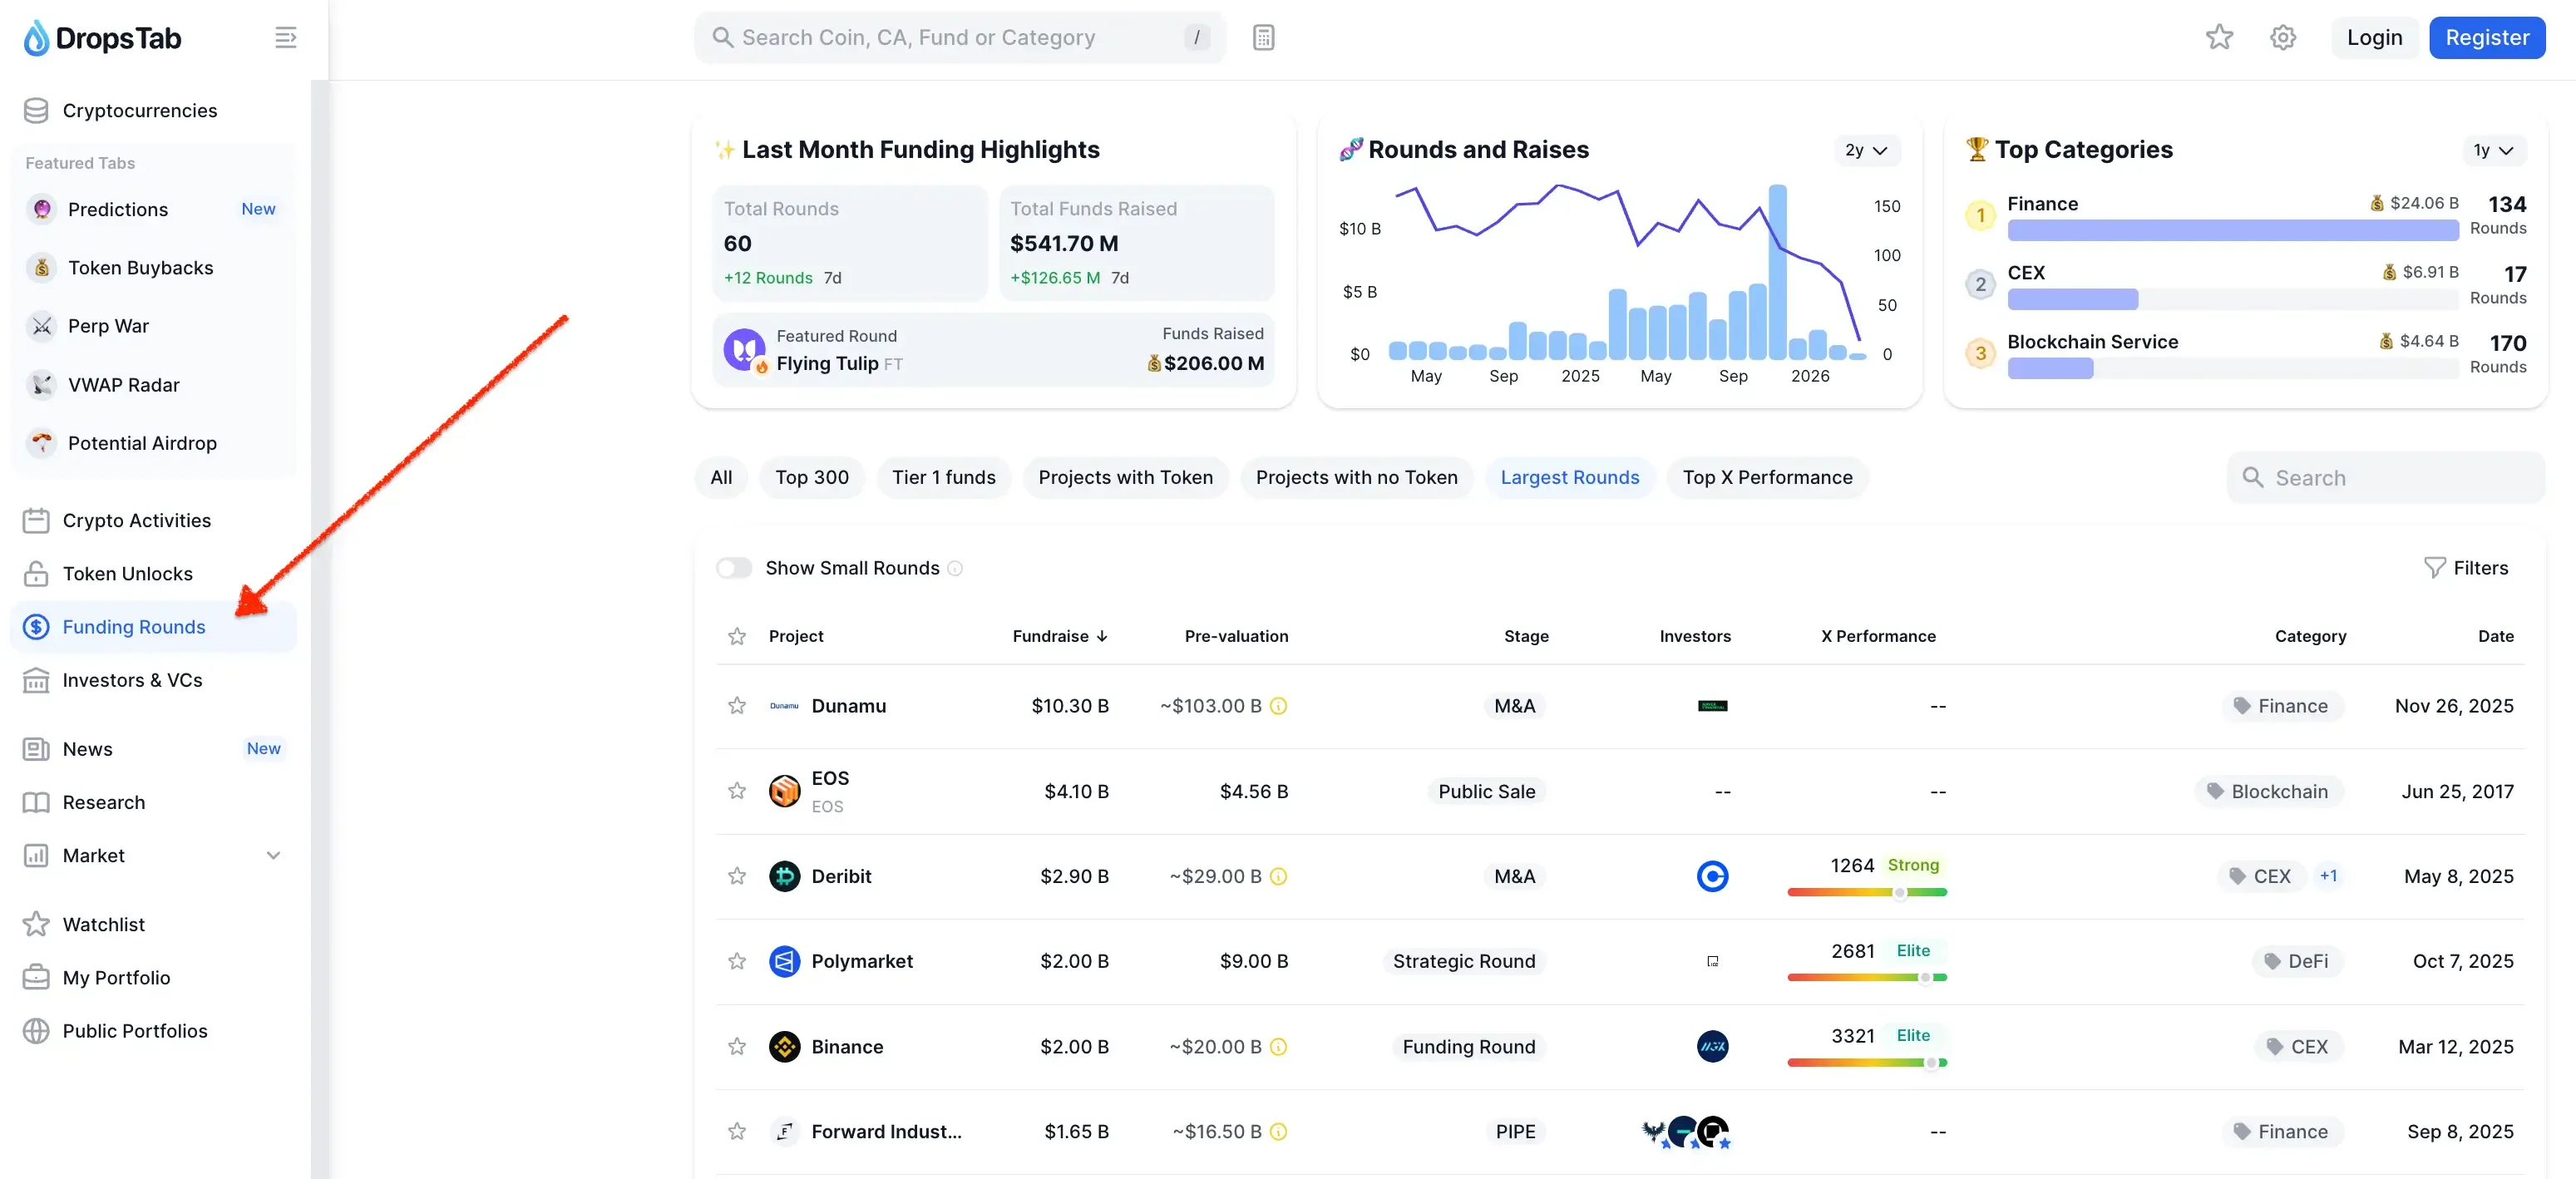
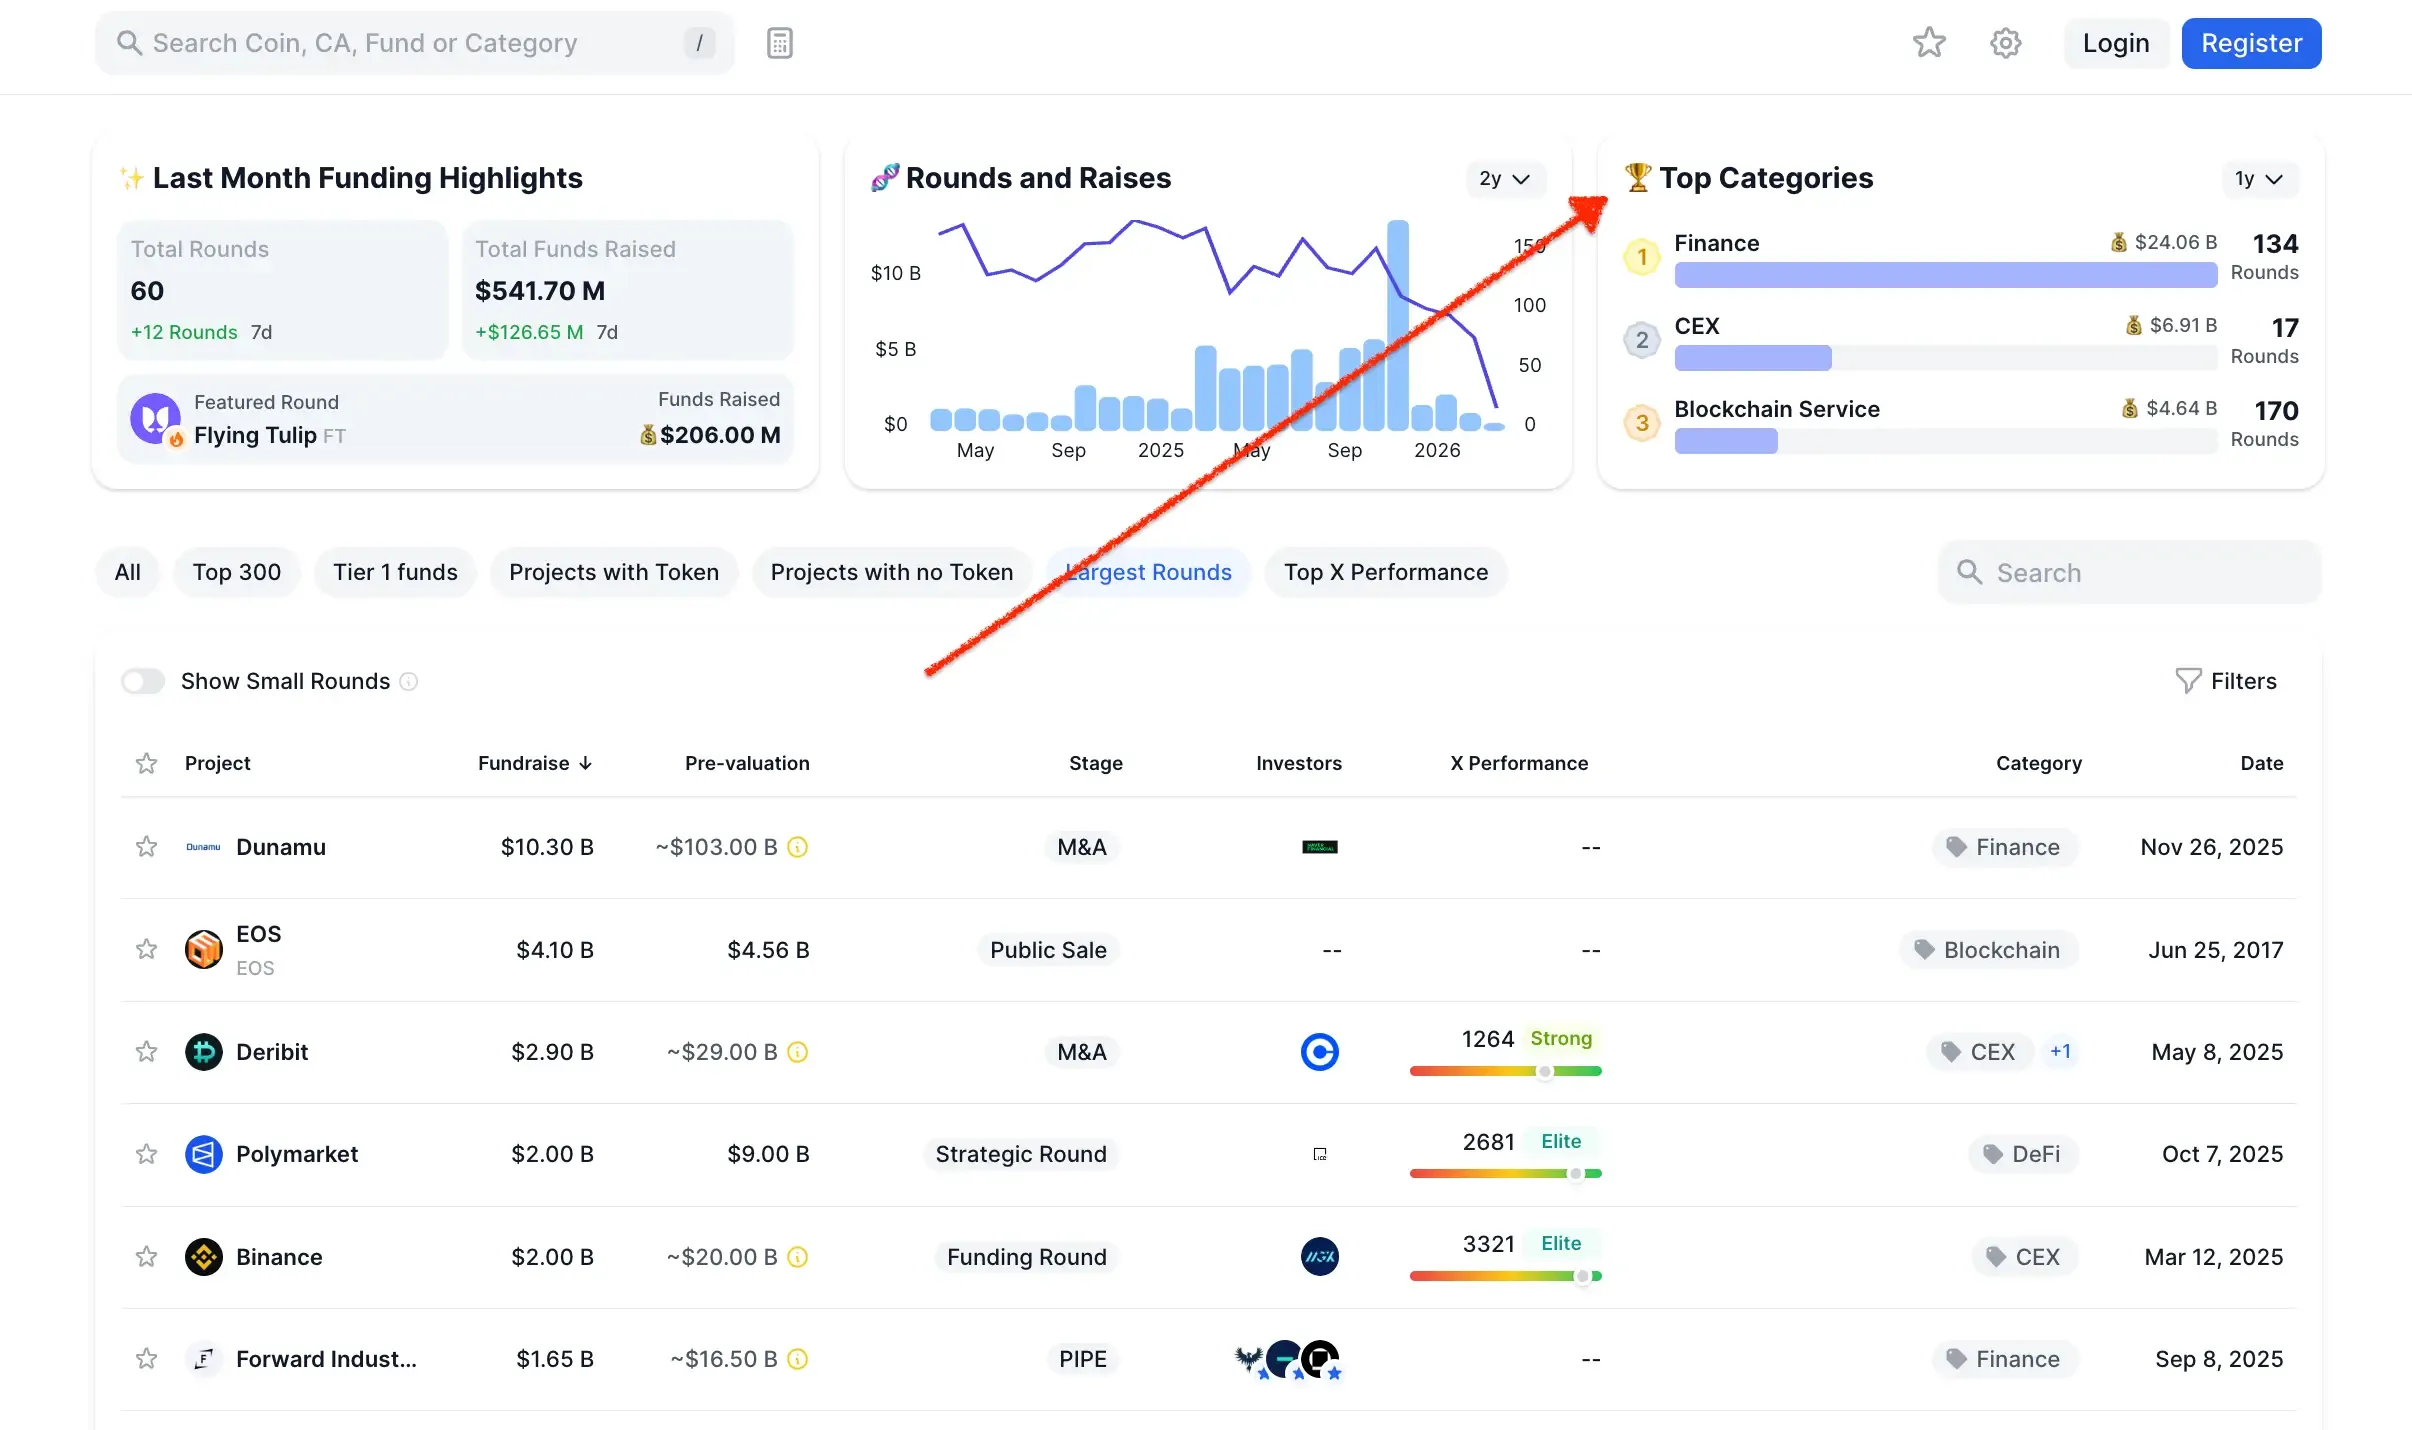
First, let's look at the Last Month Funding Highlights widget. This interface gives you a rapid macroeconomic snapshot:
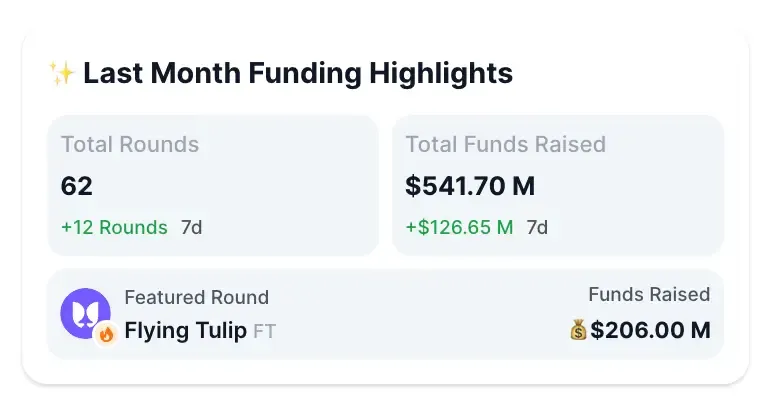
It displays the total number of funding rounds over a selected period, tracking whether deal velocity is increasing or decreasing. It also calculates the total funds raised and clearly spotlights "featured rounds"—projects that have recently secured massive capital injections.
By checking this widget daily, you train yourself to recognize the baseline pulse of the market.
Rounds and Raises
Next to this, the Rounds and Raises widget provides a trend line and bar chart. This allows you to visually track the cyclical peaks and valleys of capital injection volumes:
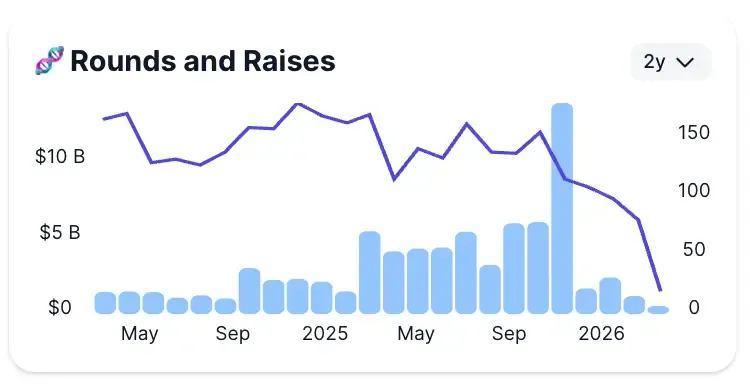
Are we currently in an accumulation phase where smart money is quietly building positions, or a distribution phase where capital is drying up? This chart answers that question instantly.
Top Categories
Finally, the Top Categories widget is your best friend for spotting emerging narratives:
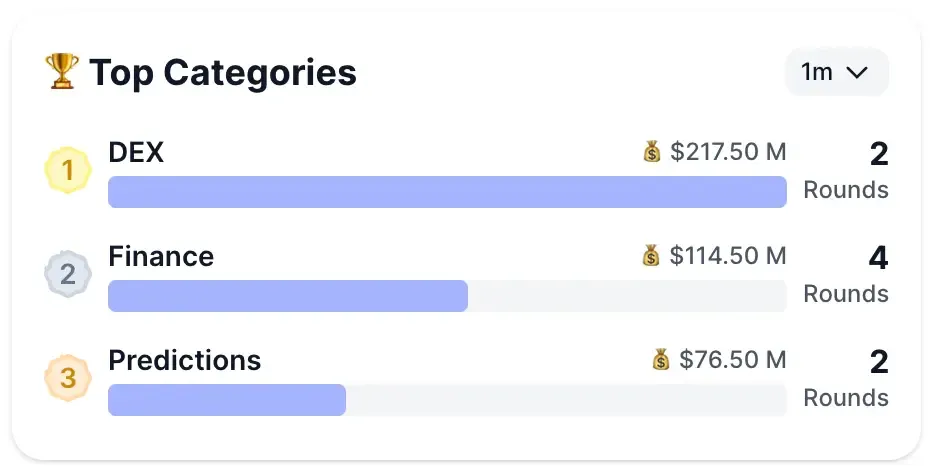
Rather than guessing what sector is hot, this widget ranks categories by capital inflow. For instance, if you see Decentralized Exchanges (DEX) or Predictions capturing the vast majority of funds across multiple rounds, you know exactly where institutional conviction lies.
Analyzing Individual Asset Funding on DropsTab
Once you have identified a promising market sector using the macro widgets, it is time to zoom in. A massive fundraising round highlighted on the Funding Rounds page means very little if you don't understand the specific history of the asset.
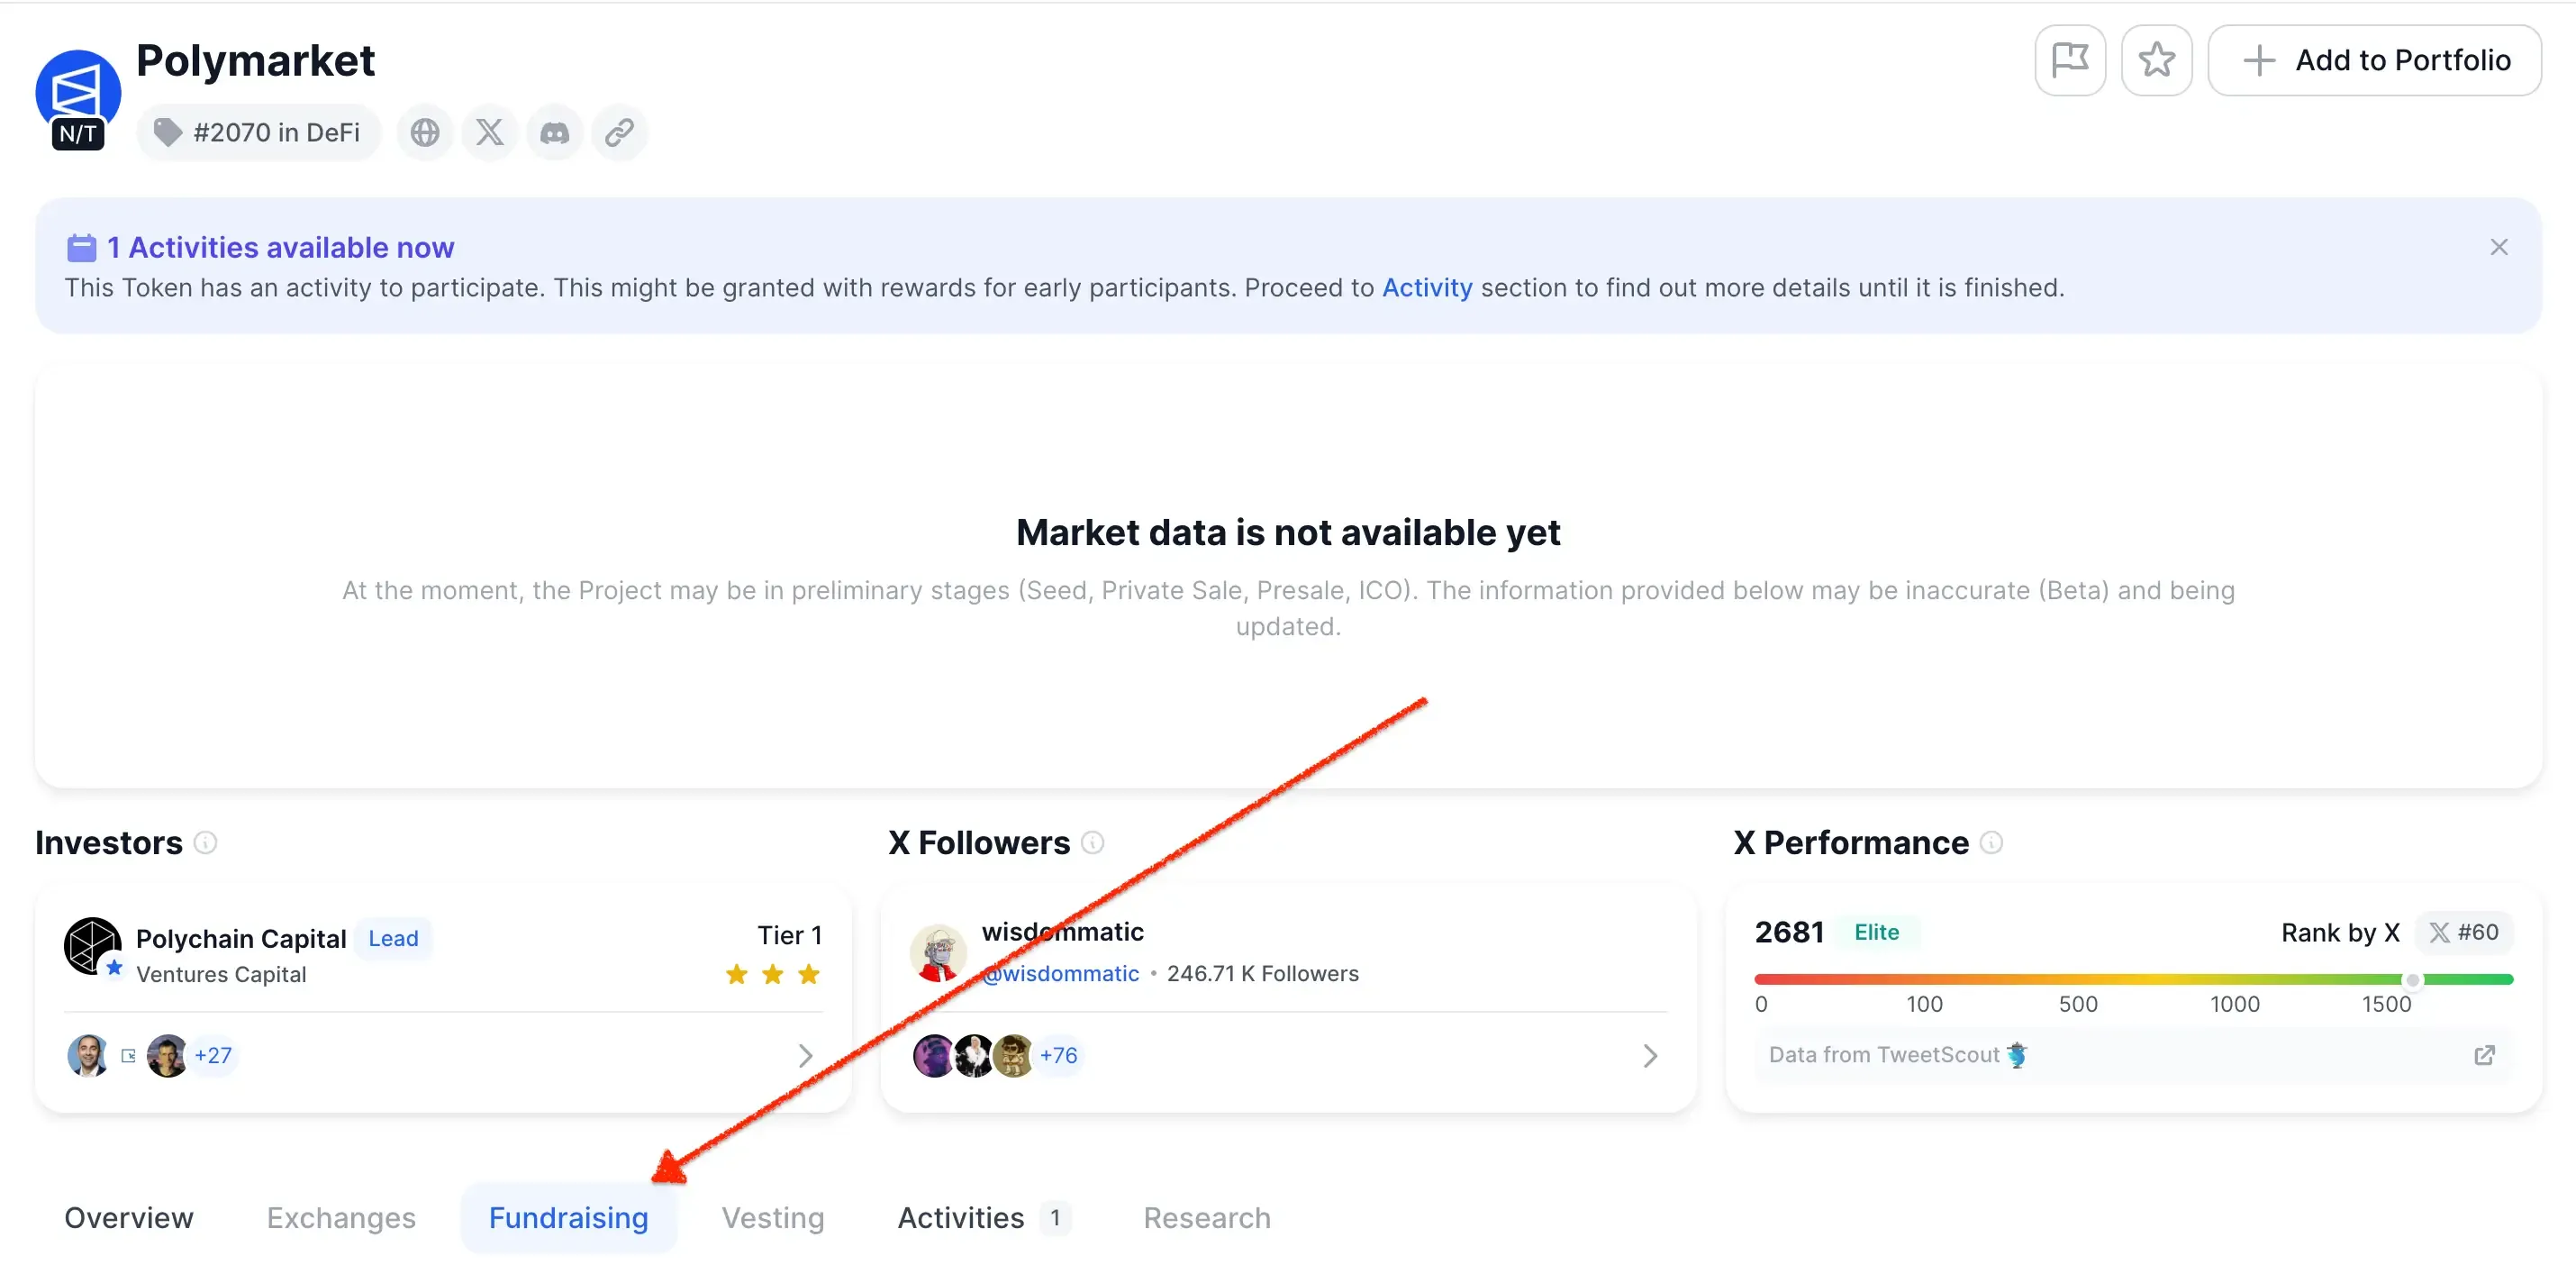
DropsTab provides incredibly detailed infographics on the individual coin pages. Using Solana as an example, let's look at how to navigate an asset's specific “Fundraising" tab.
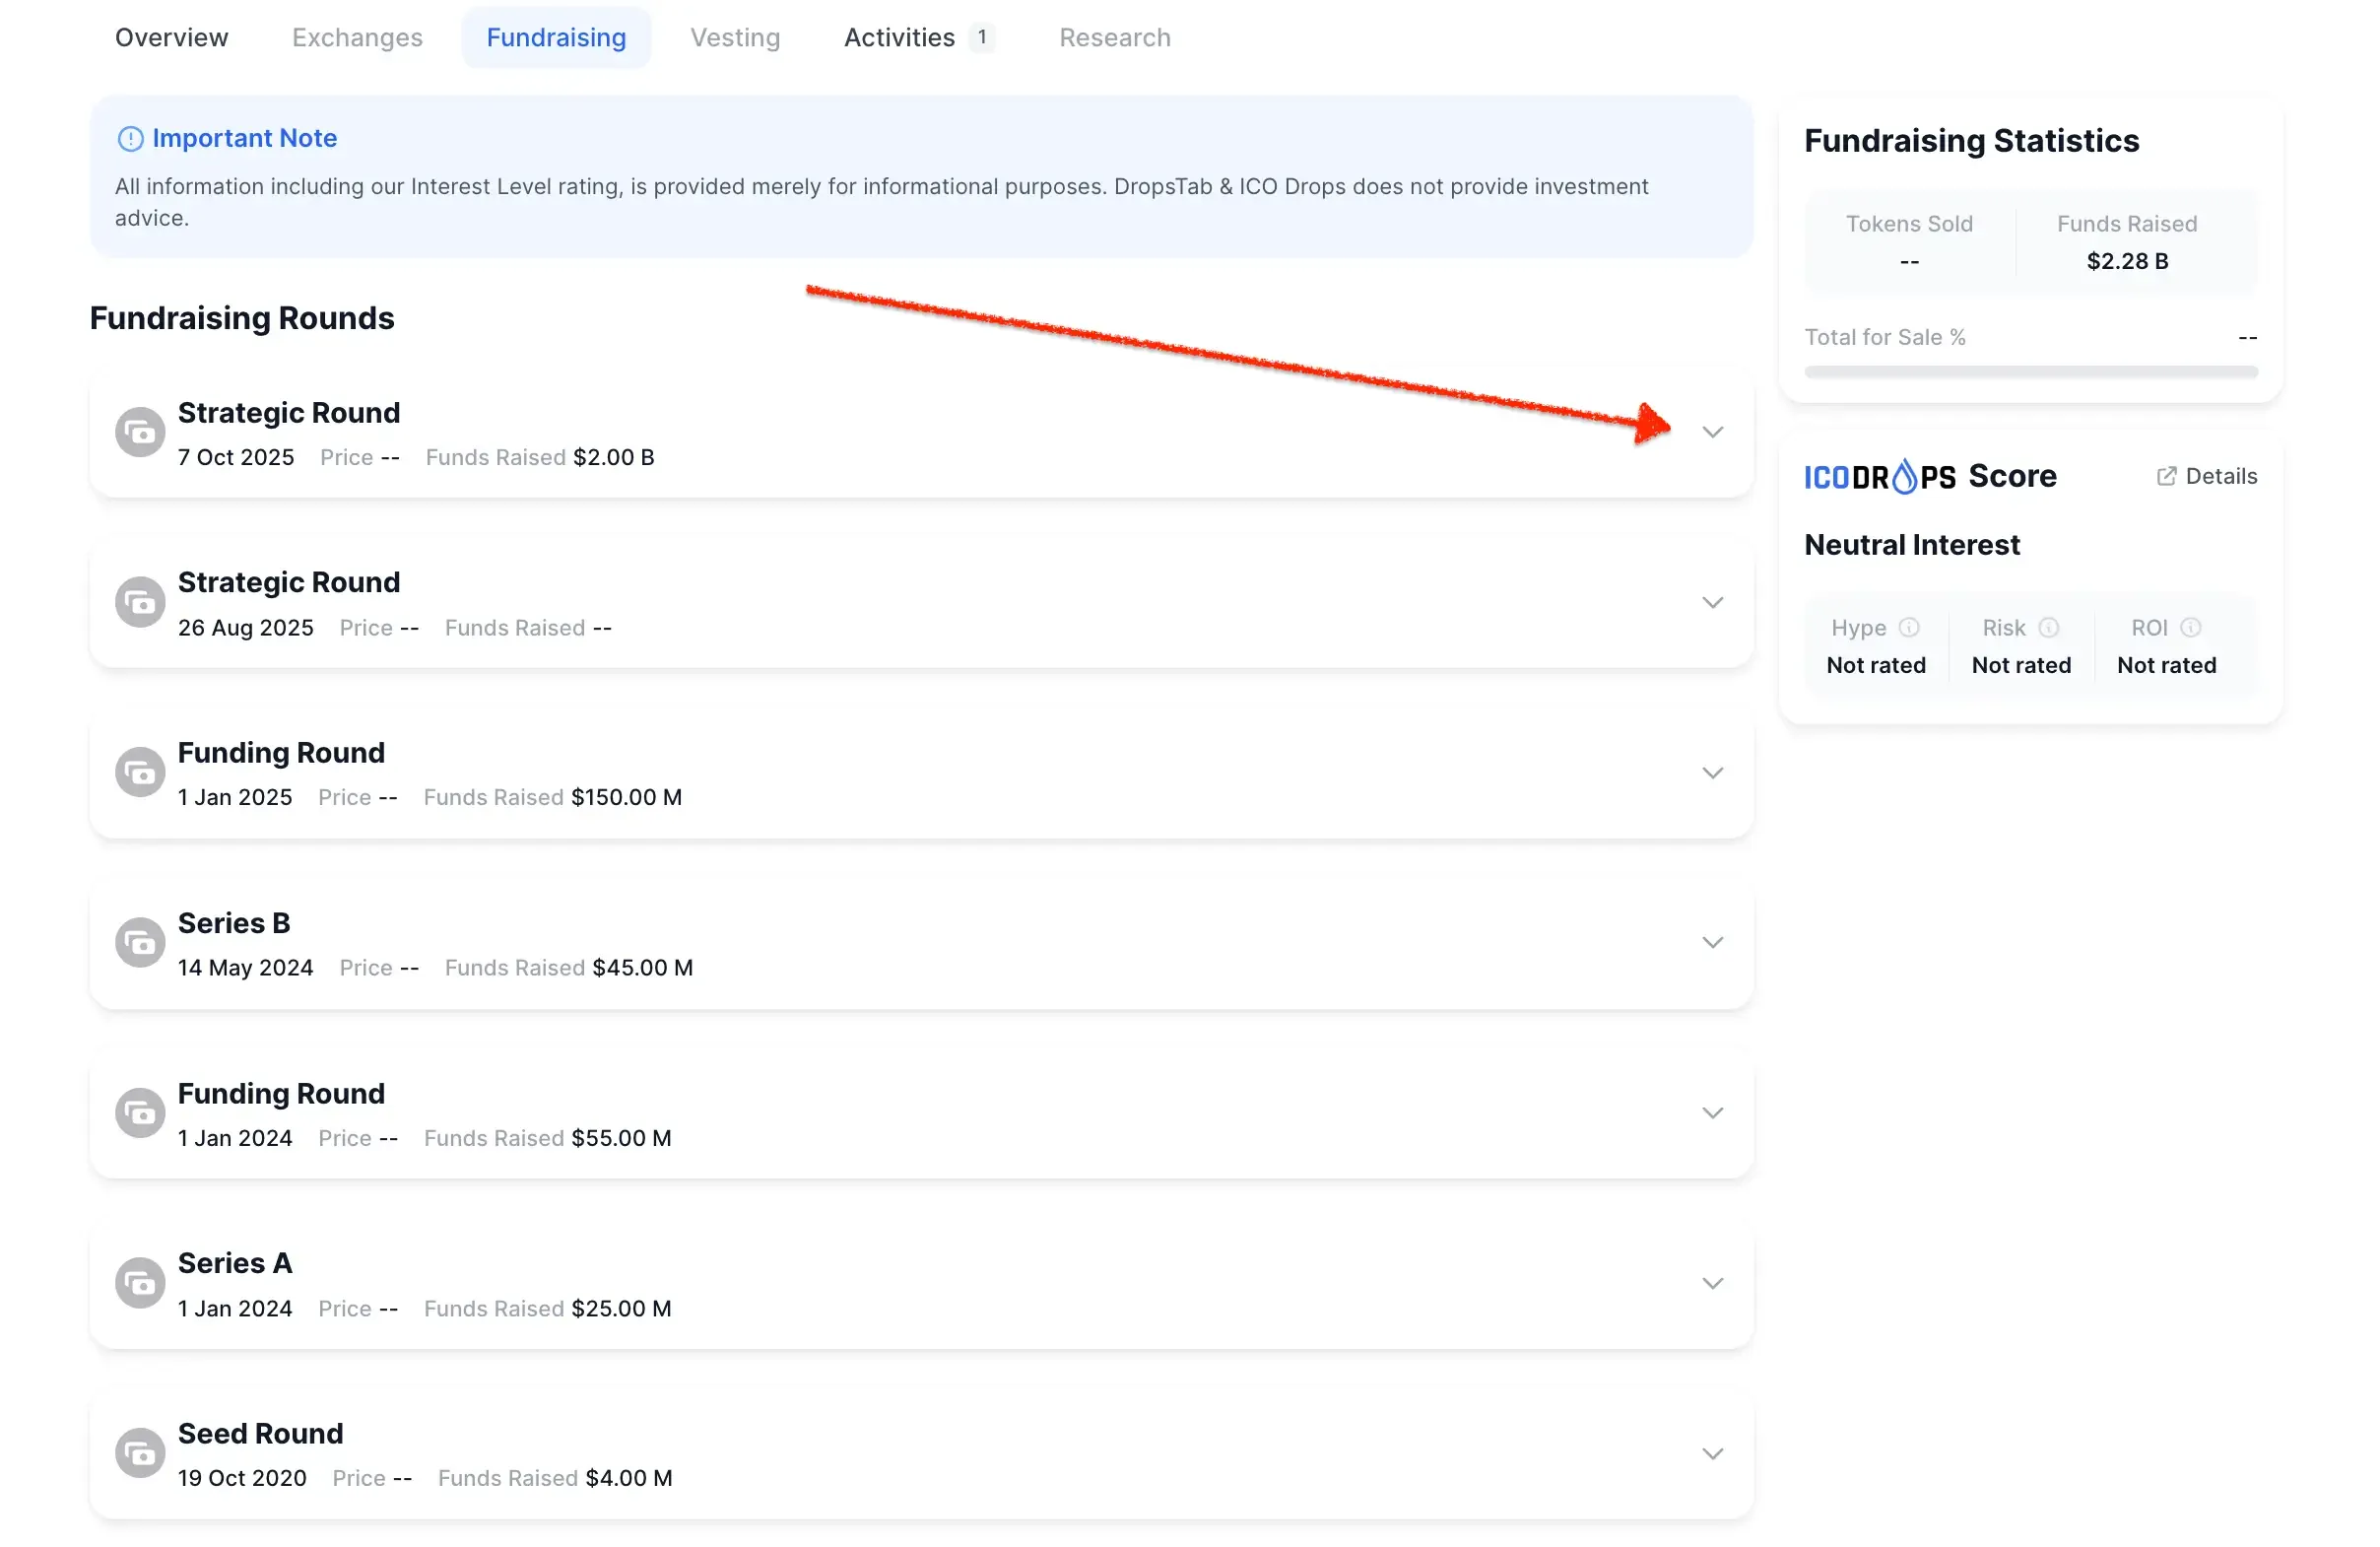
1. The Fundraising Rounds Timeline
When you navigate to the "Funding" tab of any specific coin, the first thing you will see is a chronological list of all its historical funding rounds:
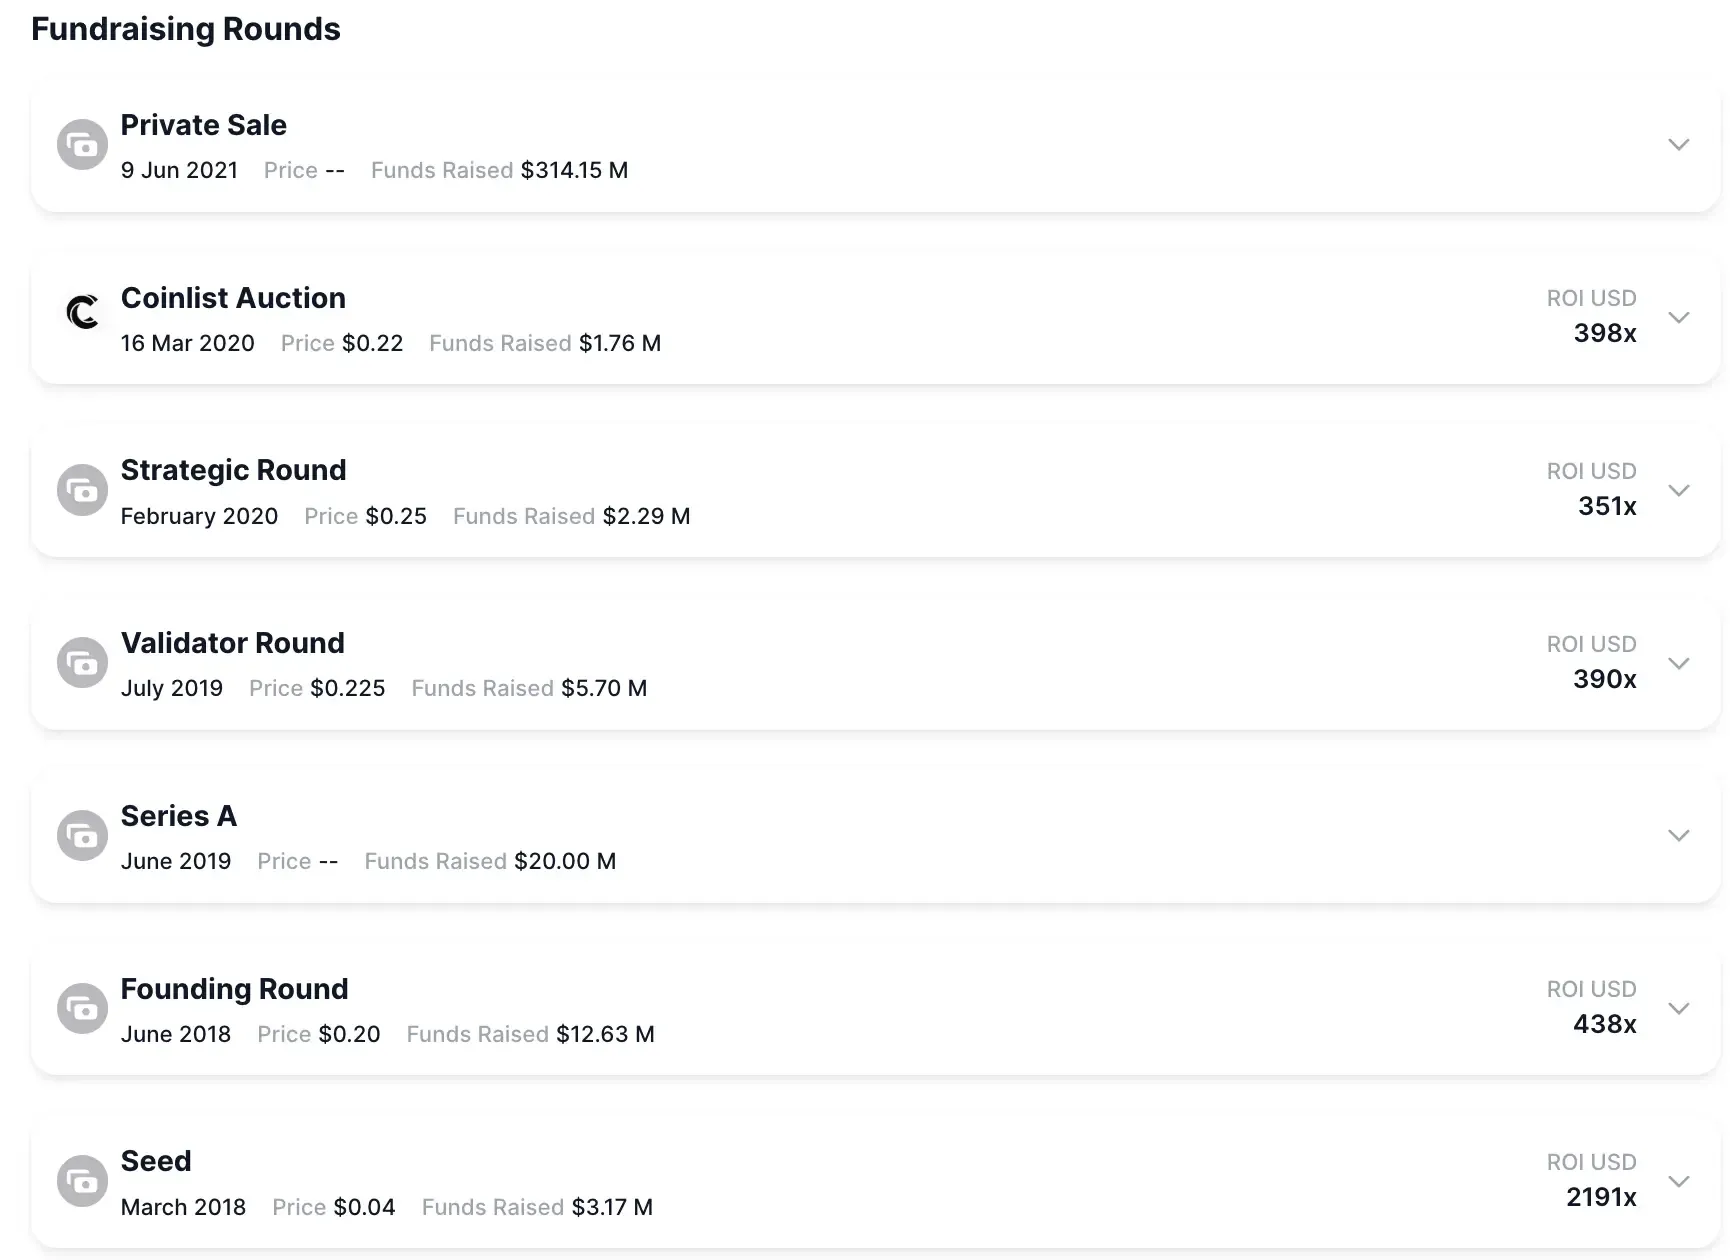
As seen in the example infographic, this lists every event from the earliest "Seed" round all the way up to "Private Sales" or "Strategic Rounds." It gives you an immediate bird's-eye view of the project's financial journey, displaying the date, the price per token at that round, the total funds raised, and the current ROI in USD.
This is vital for understanding how early investors are positioned compared to current retail buyers.
2. Expanding for Granular Intel
To facilitate your research, you are not just limited to surface-level data. You can view specific, granular information for each funding round by simply expanding the item:
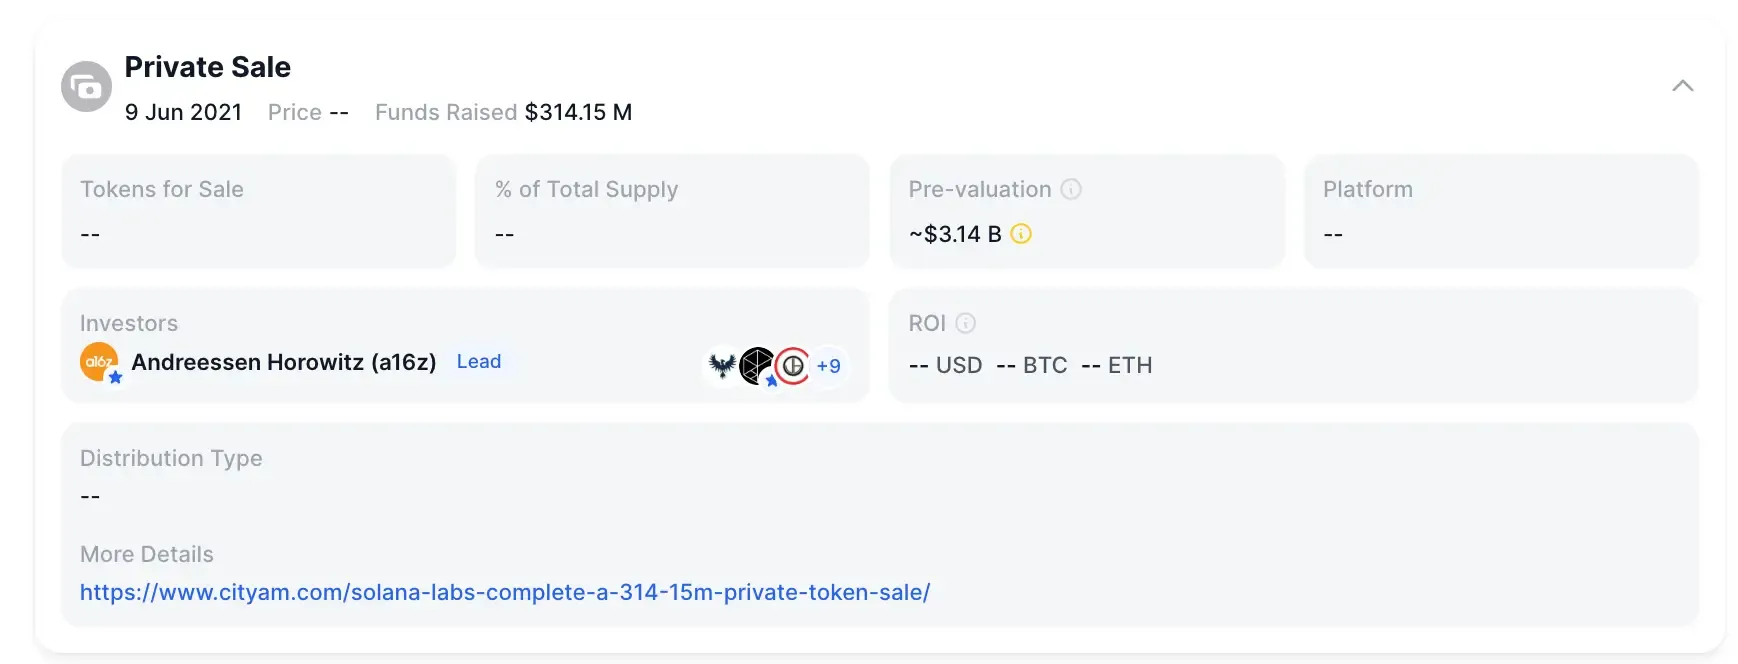
Clicking the drop-down arrow on a specific round (like a "Private Sale") reveals a wealth of data. As shown in the example, you can instantly see:
- Tokens for Sale & % of Total Supply: How much of the network was sold off in this specific round.
- Pre-valuation: What the project was valued at before the money was injected.
- Investors: Crucially, this shows you exactly who is backing the project. Is it led by Tier-1 funds like a16z, or unknown entities?
- More Details: Links to official press releases for further reading.
3. Tracking the Smart Money: The Investors Table
If you scroll down a bit on that exact same "Fundraising" tab, you're going to hit the overall Investors table. This is honestly one of my favorite parts of the platform.
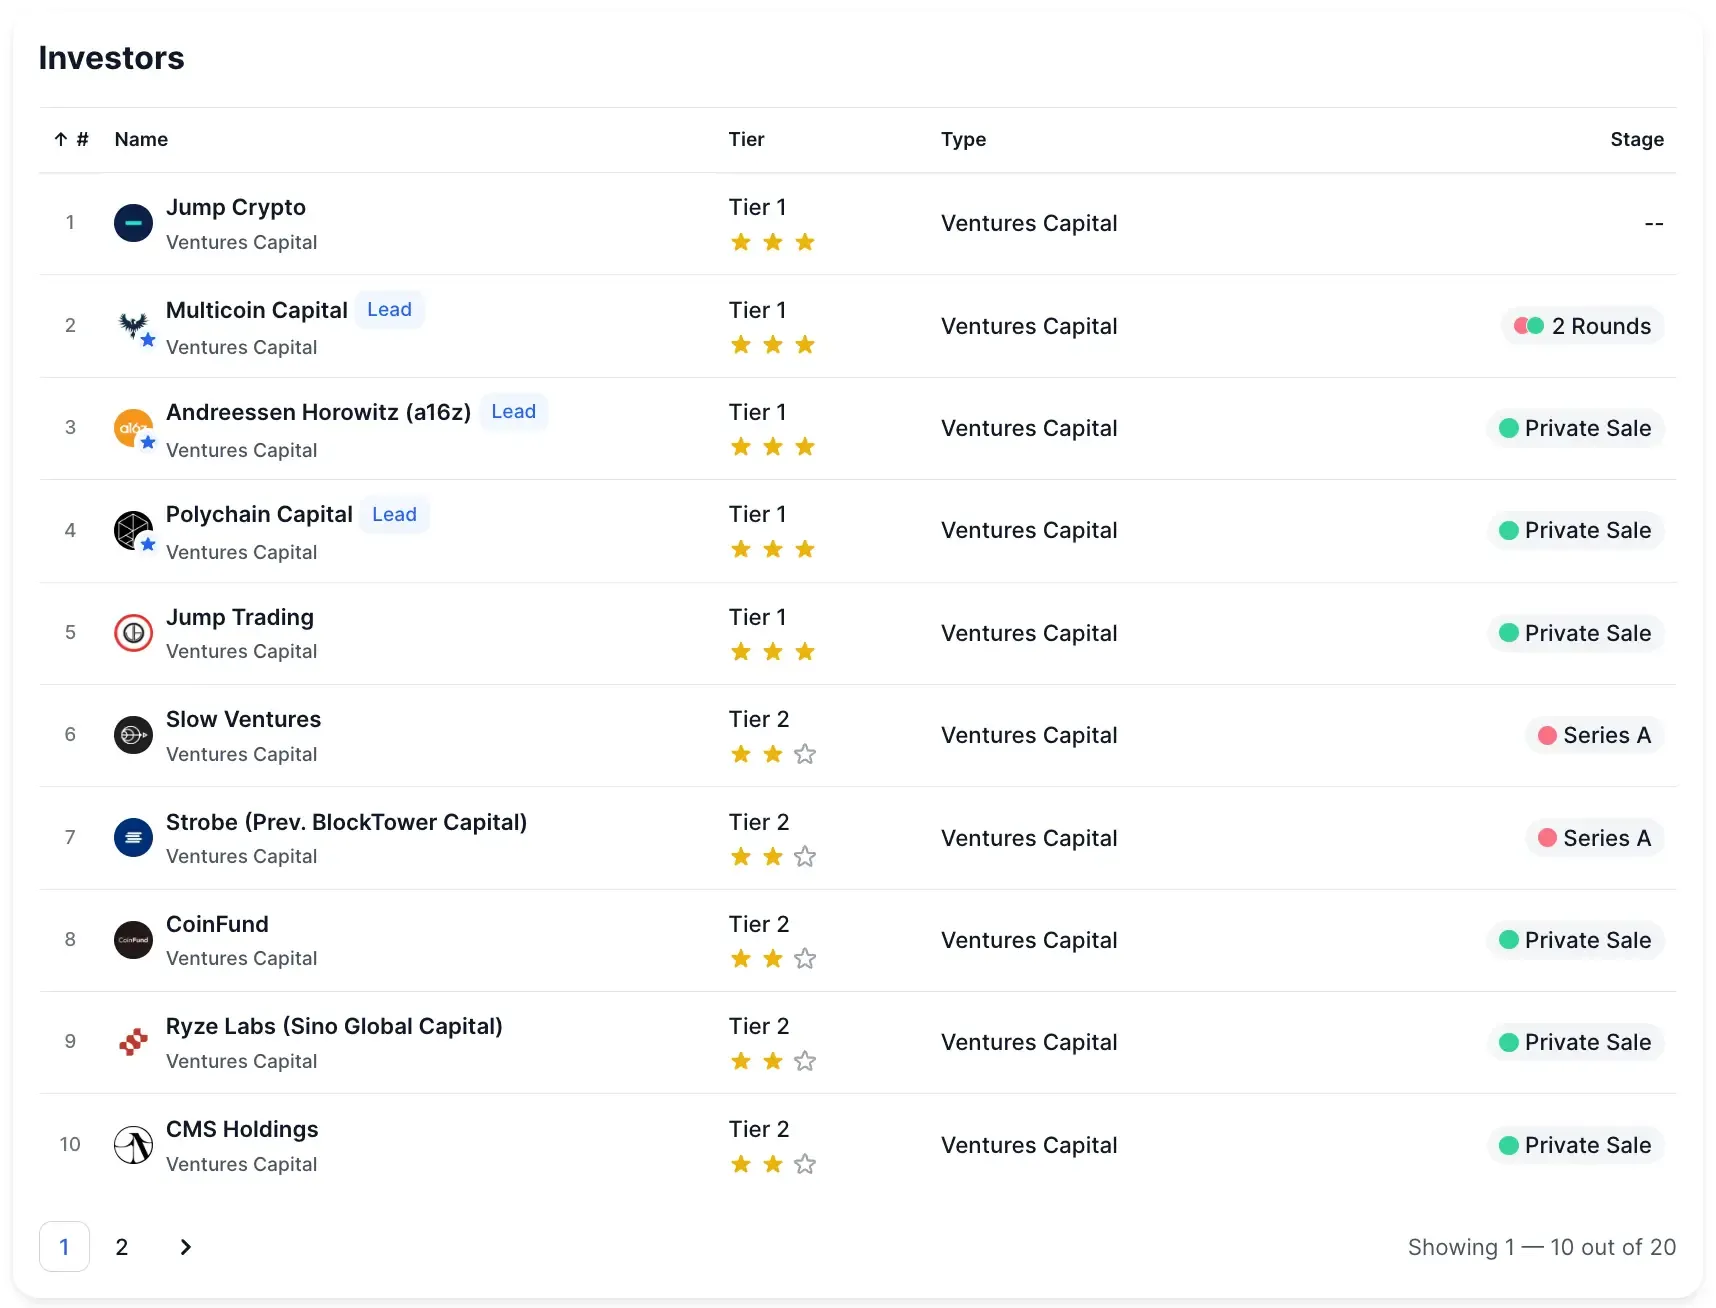
Instead of just giving you a random wall of names, the platform actually categorizes every single entity backing the project. You can see right away if the asset is dominated by "Tier 1" venture capital—like Jump Crypto, Multicoin Capital, or a16z in this Solana example—or if it's mostly unknown funds. It breaks down the exact stage they got in on and what type of investor they are. It’s just a really quick way to see if the "smart money" actually has high, sustained conviction here.
4. Fundraising Statistics & Trade Launch
Finally, at the top of the funding tab for each coin, users can find the overall "Fundraising Statistics" card:
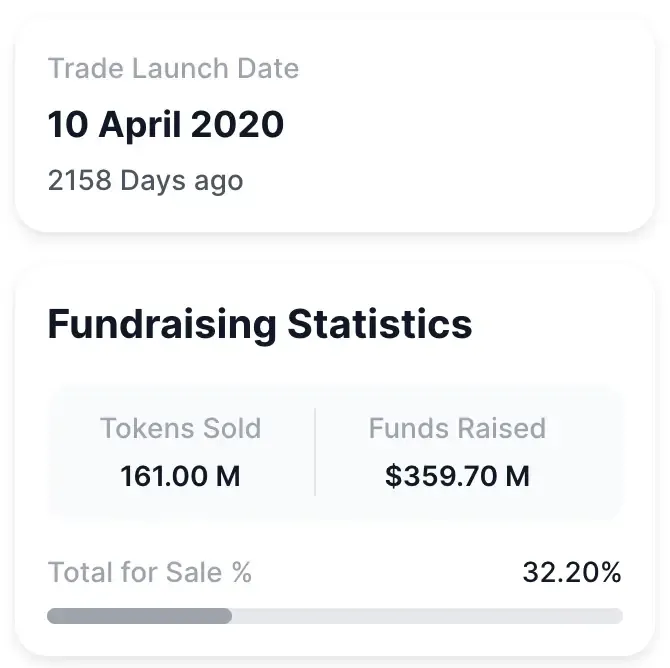
This is where you calculate the asset's structural risk. The infographic clearly displays the "Trade Launch Date" to tell you exactly how long the token has been live. More importantly, it aggregates the "Tokens Sold" and the "Total for Sale %."
If you see that a massive percentage of the supply was sold to private investors before the trade launch date, you must immediately flag the asset for high structural dilution risk.
Step-by-Step Guide: Evaluating a Project
Alright, enough theory. It’s time to actually put this into practice. Honestly, staring at a wall of venture capital data is overwhelming for anyone, so facilitating your research through a structured—or at least, semi-structured—step-by-step logic is really the only way you'll transform those complex numbers into actual, actionable investment strategies. Let’s walk through how I usually do this.
Step 1: Identify the Narrative
First, head over to the DropsTab Funding Rounds page.
Don't just start randomly scrolling the main list. Instead, use the "Top Categories" widget right away to identify which specific sector is currently capturing the most venture capital. You always want to figure out where the narrative is flowing first.
Step 2: Apply Granular Filters to Find Projects
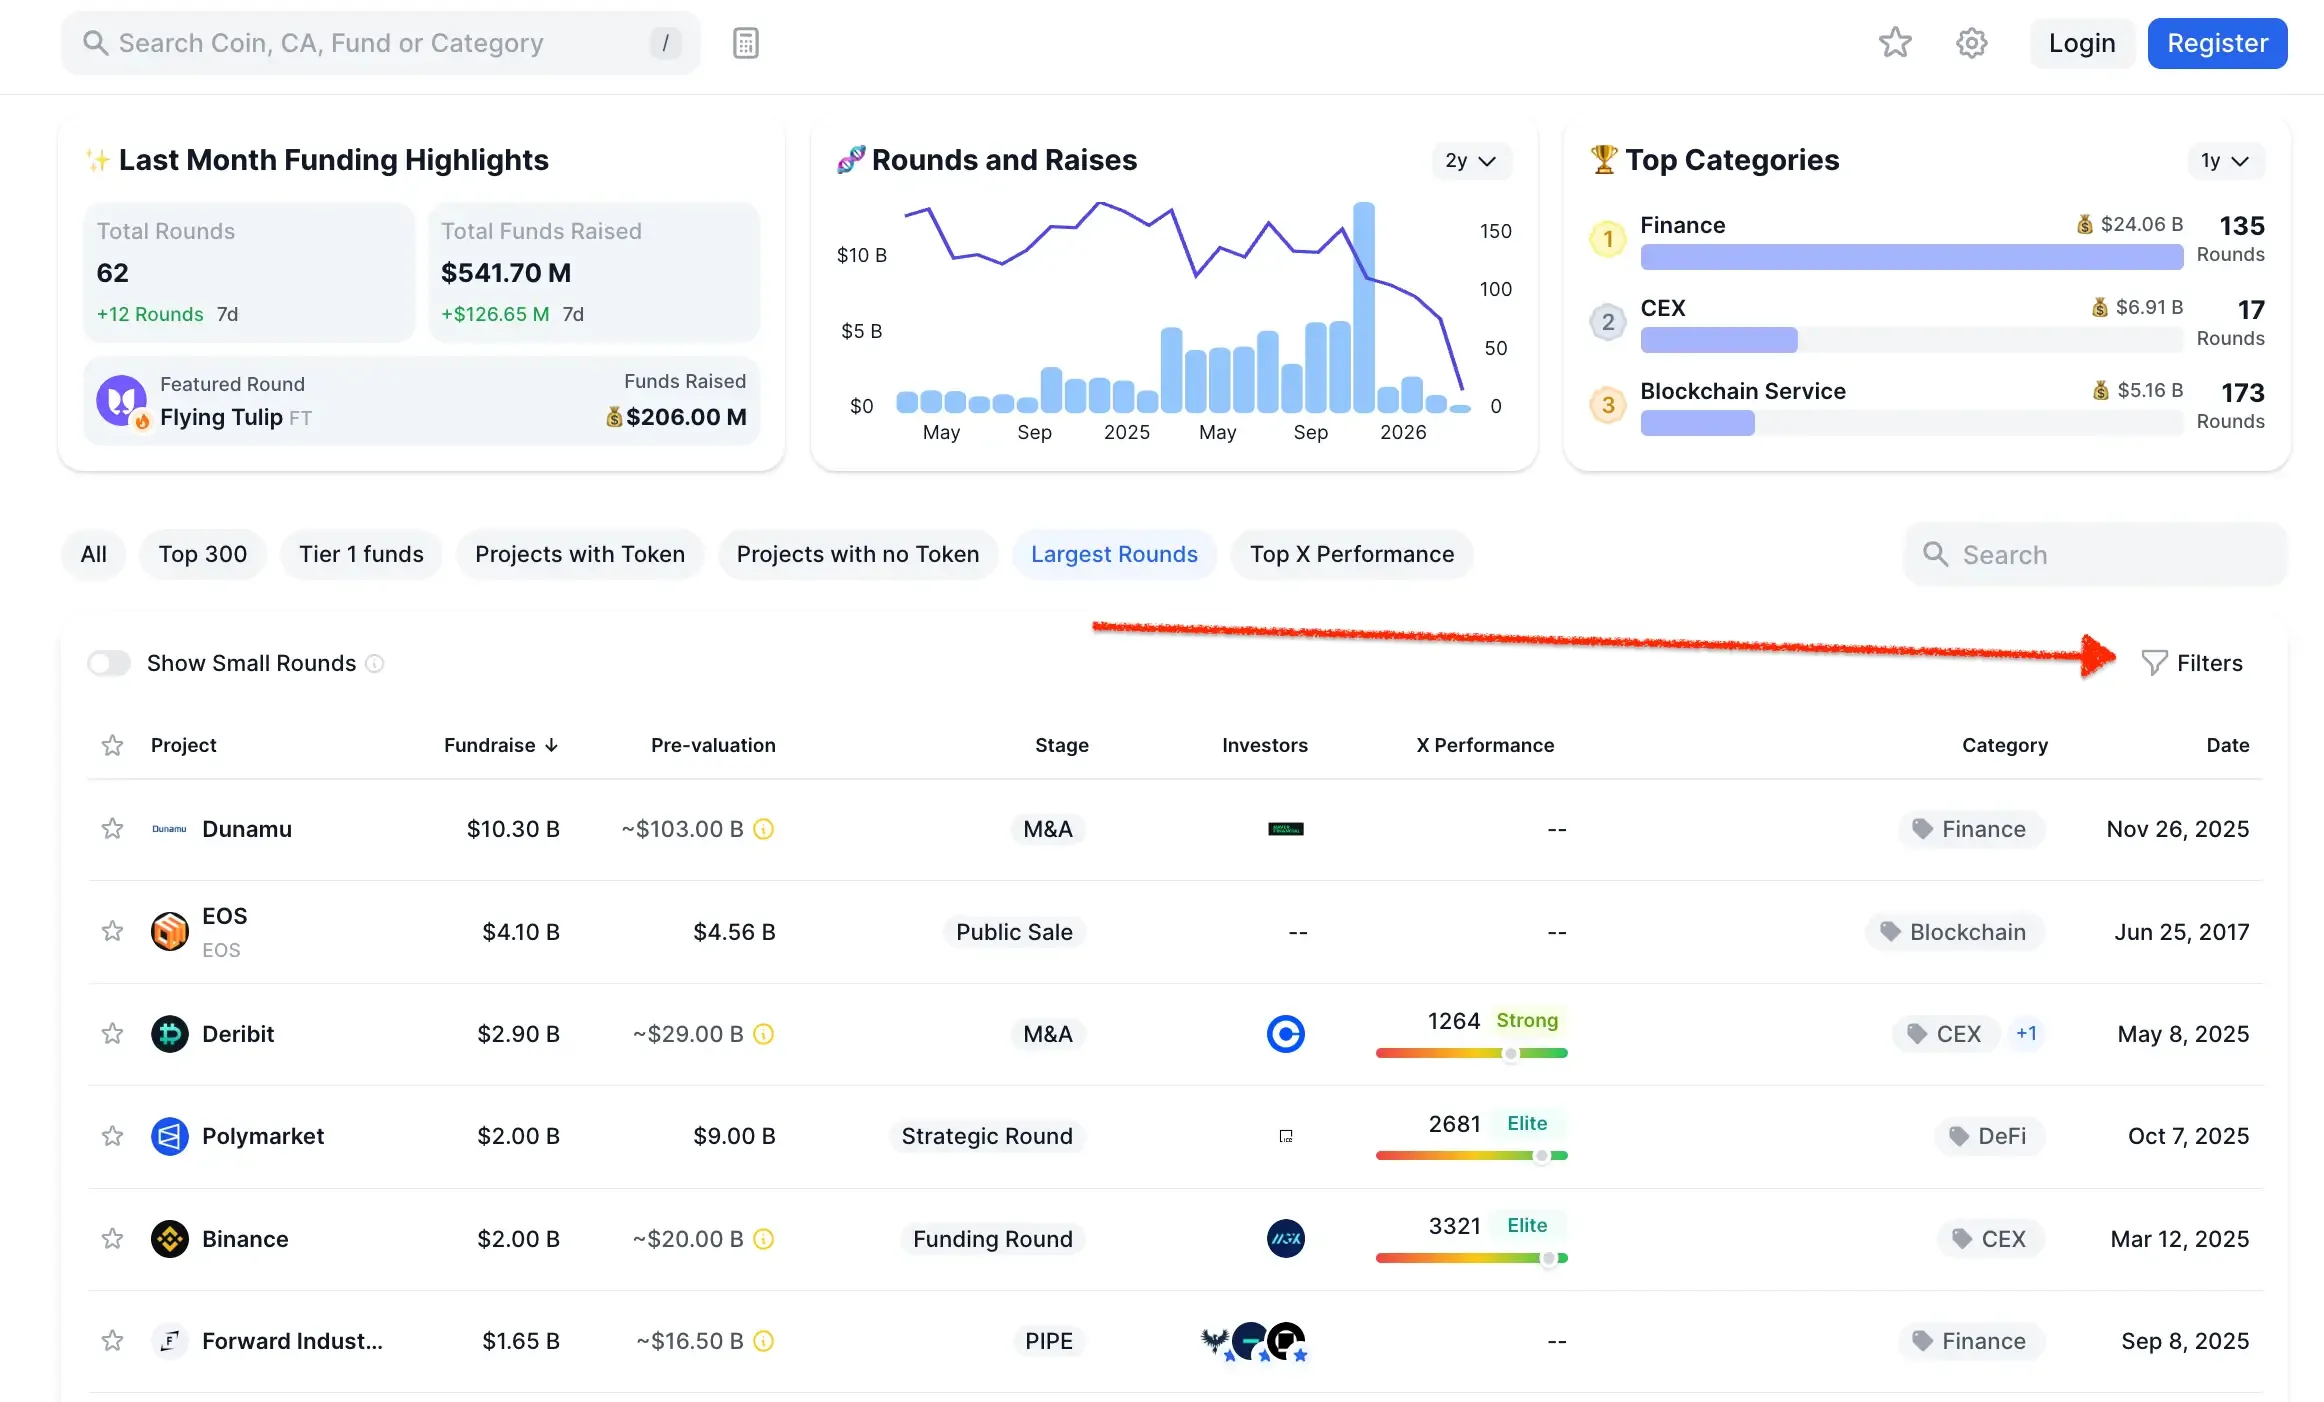
Once you have a sector in mind, stay on the main Fundraising page but click the "Filters" button. This opens up a pretty robust sorting menu.
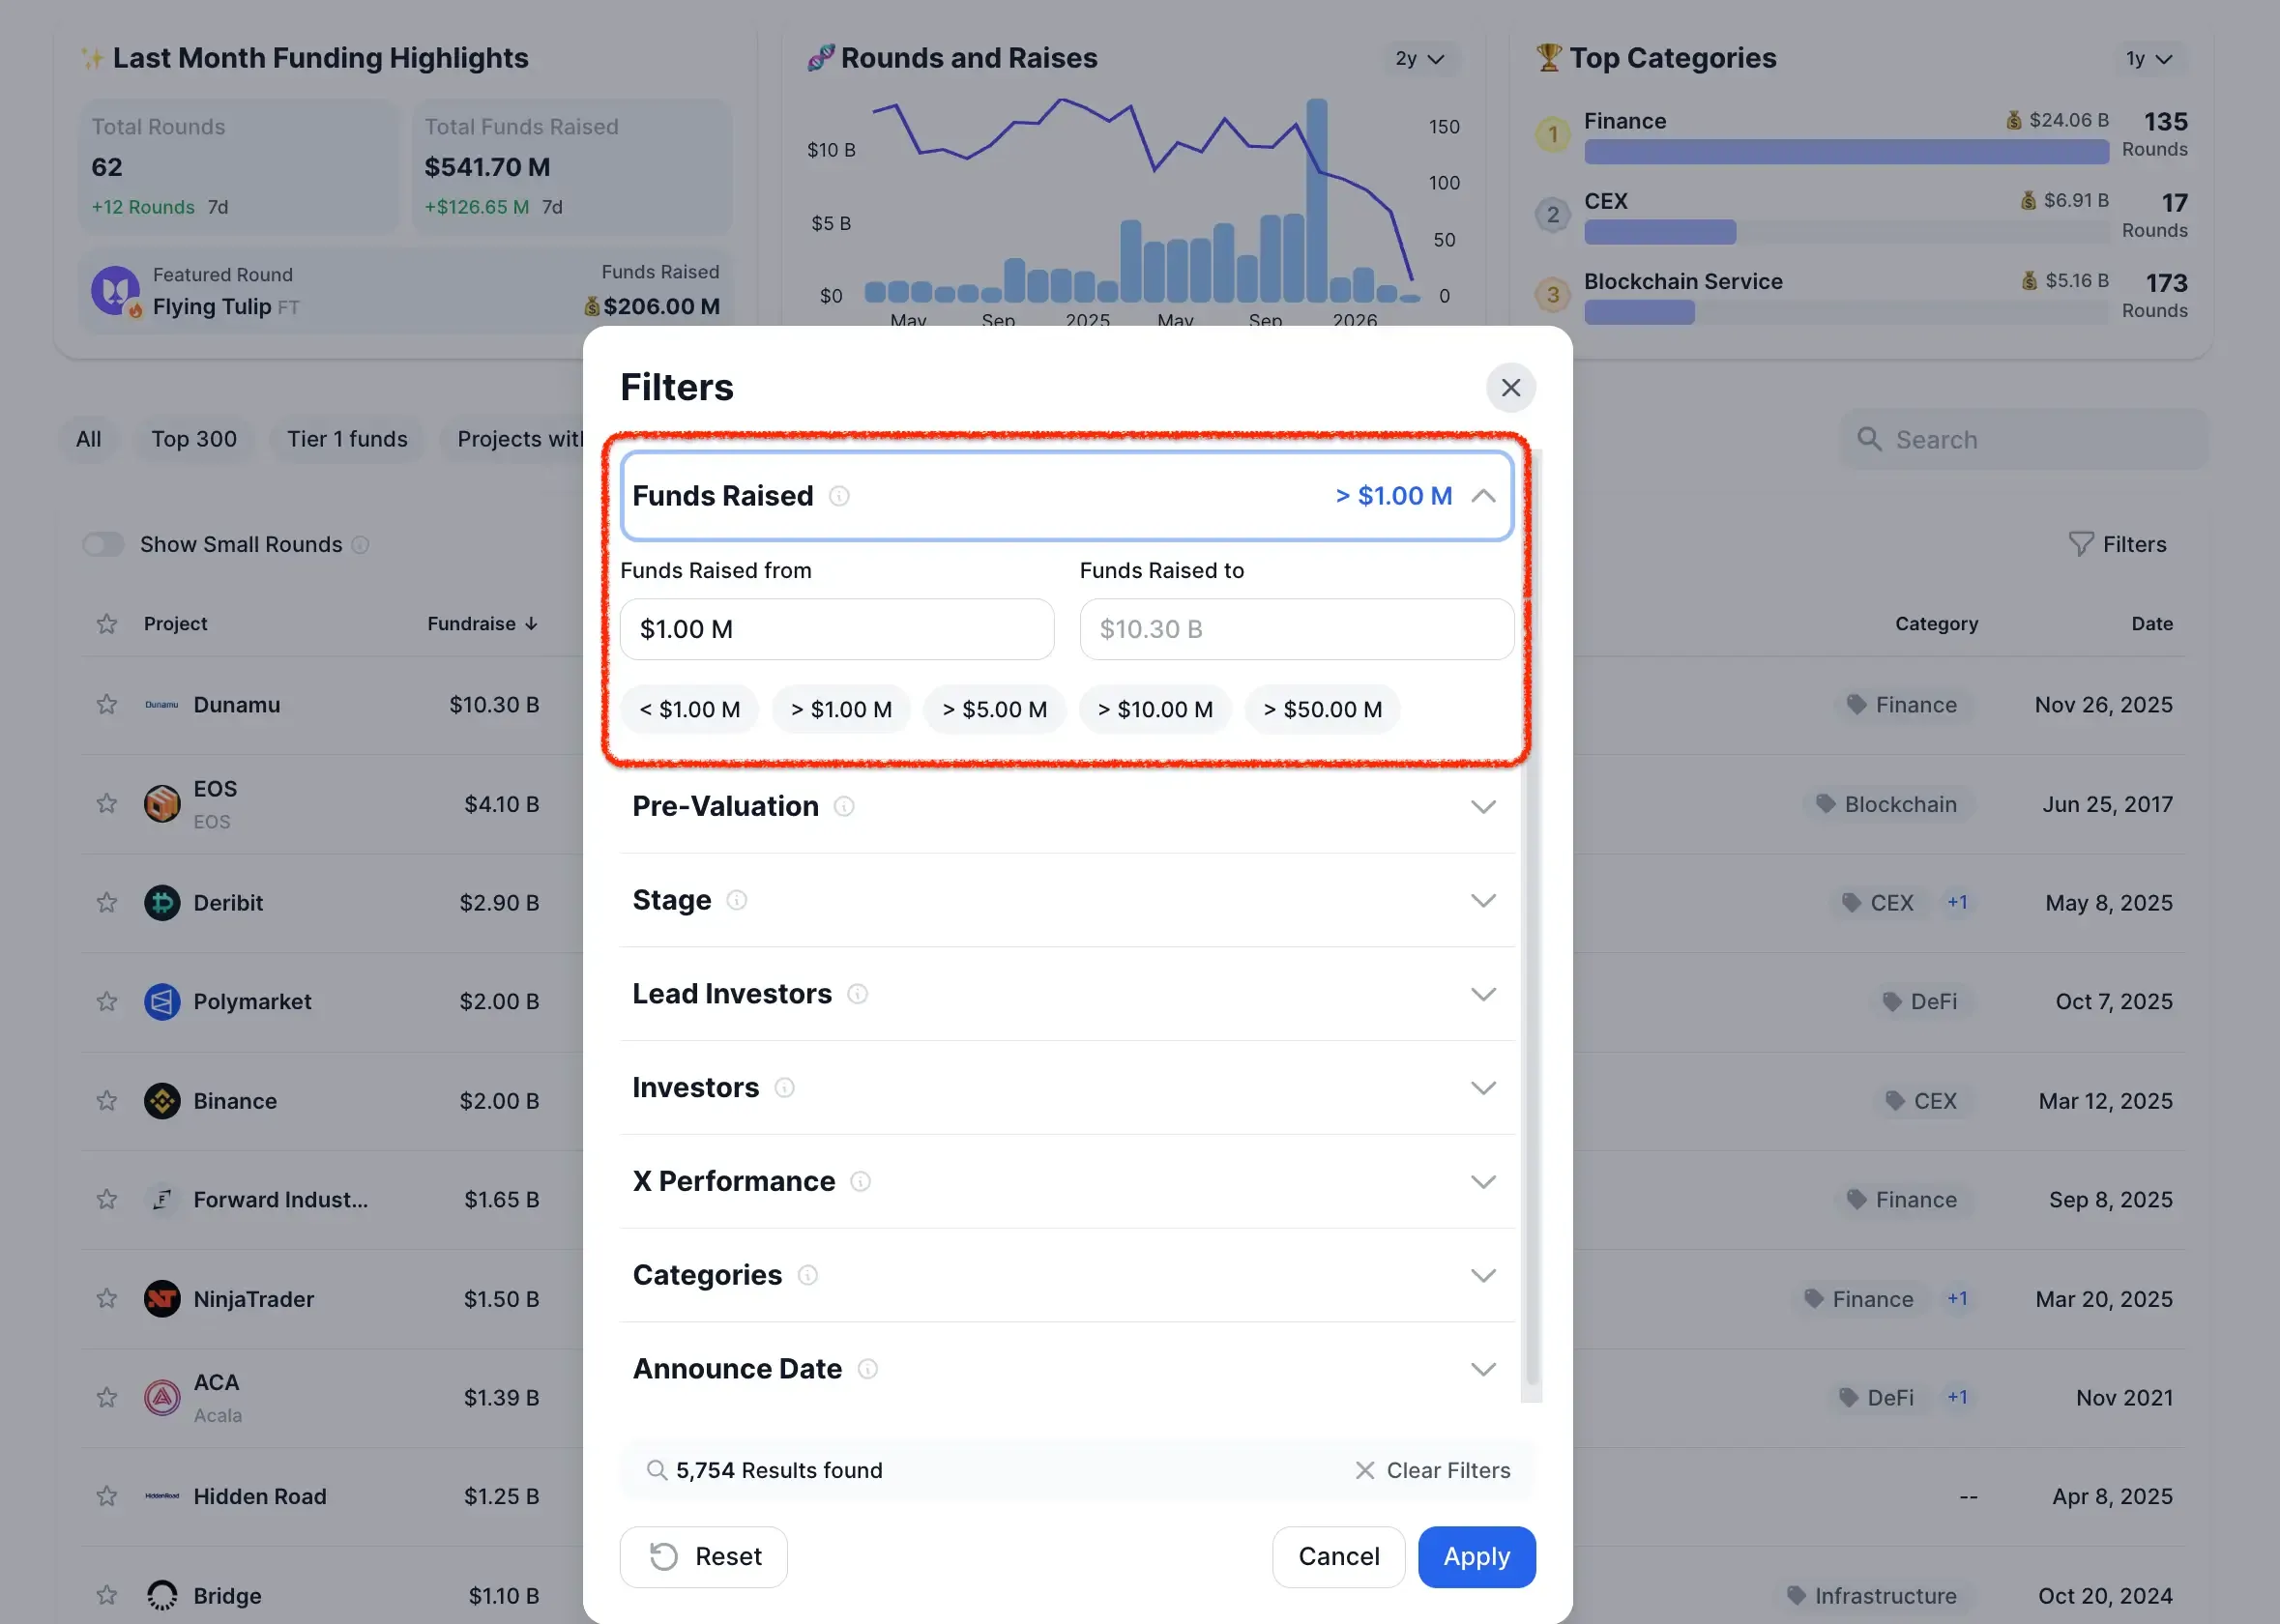
I highly recommend filtering by "Funds Raised" first. For example, setting a baseline of > $1.00 M is a great way to immediately weed out the noisy, hyper-risky micro-projects.
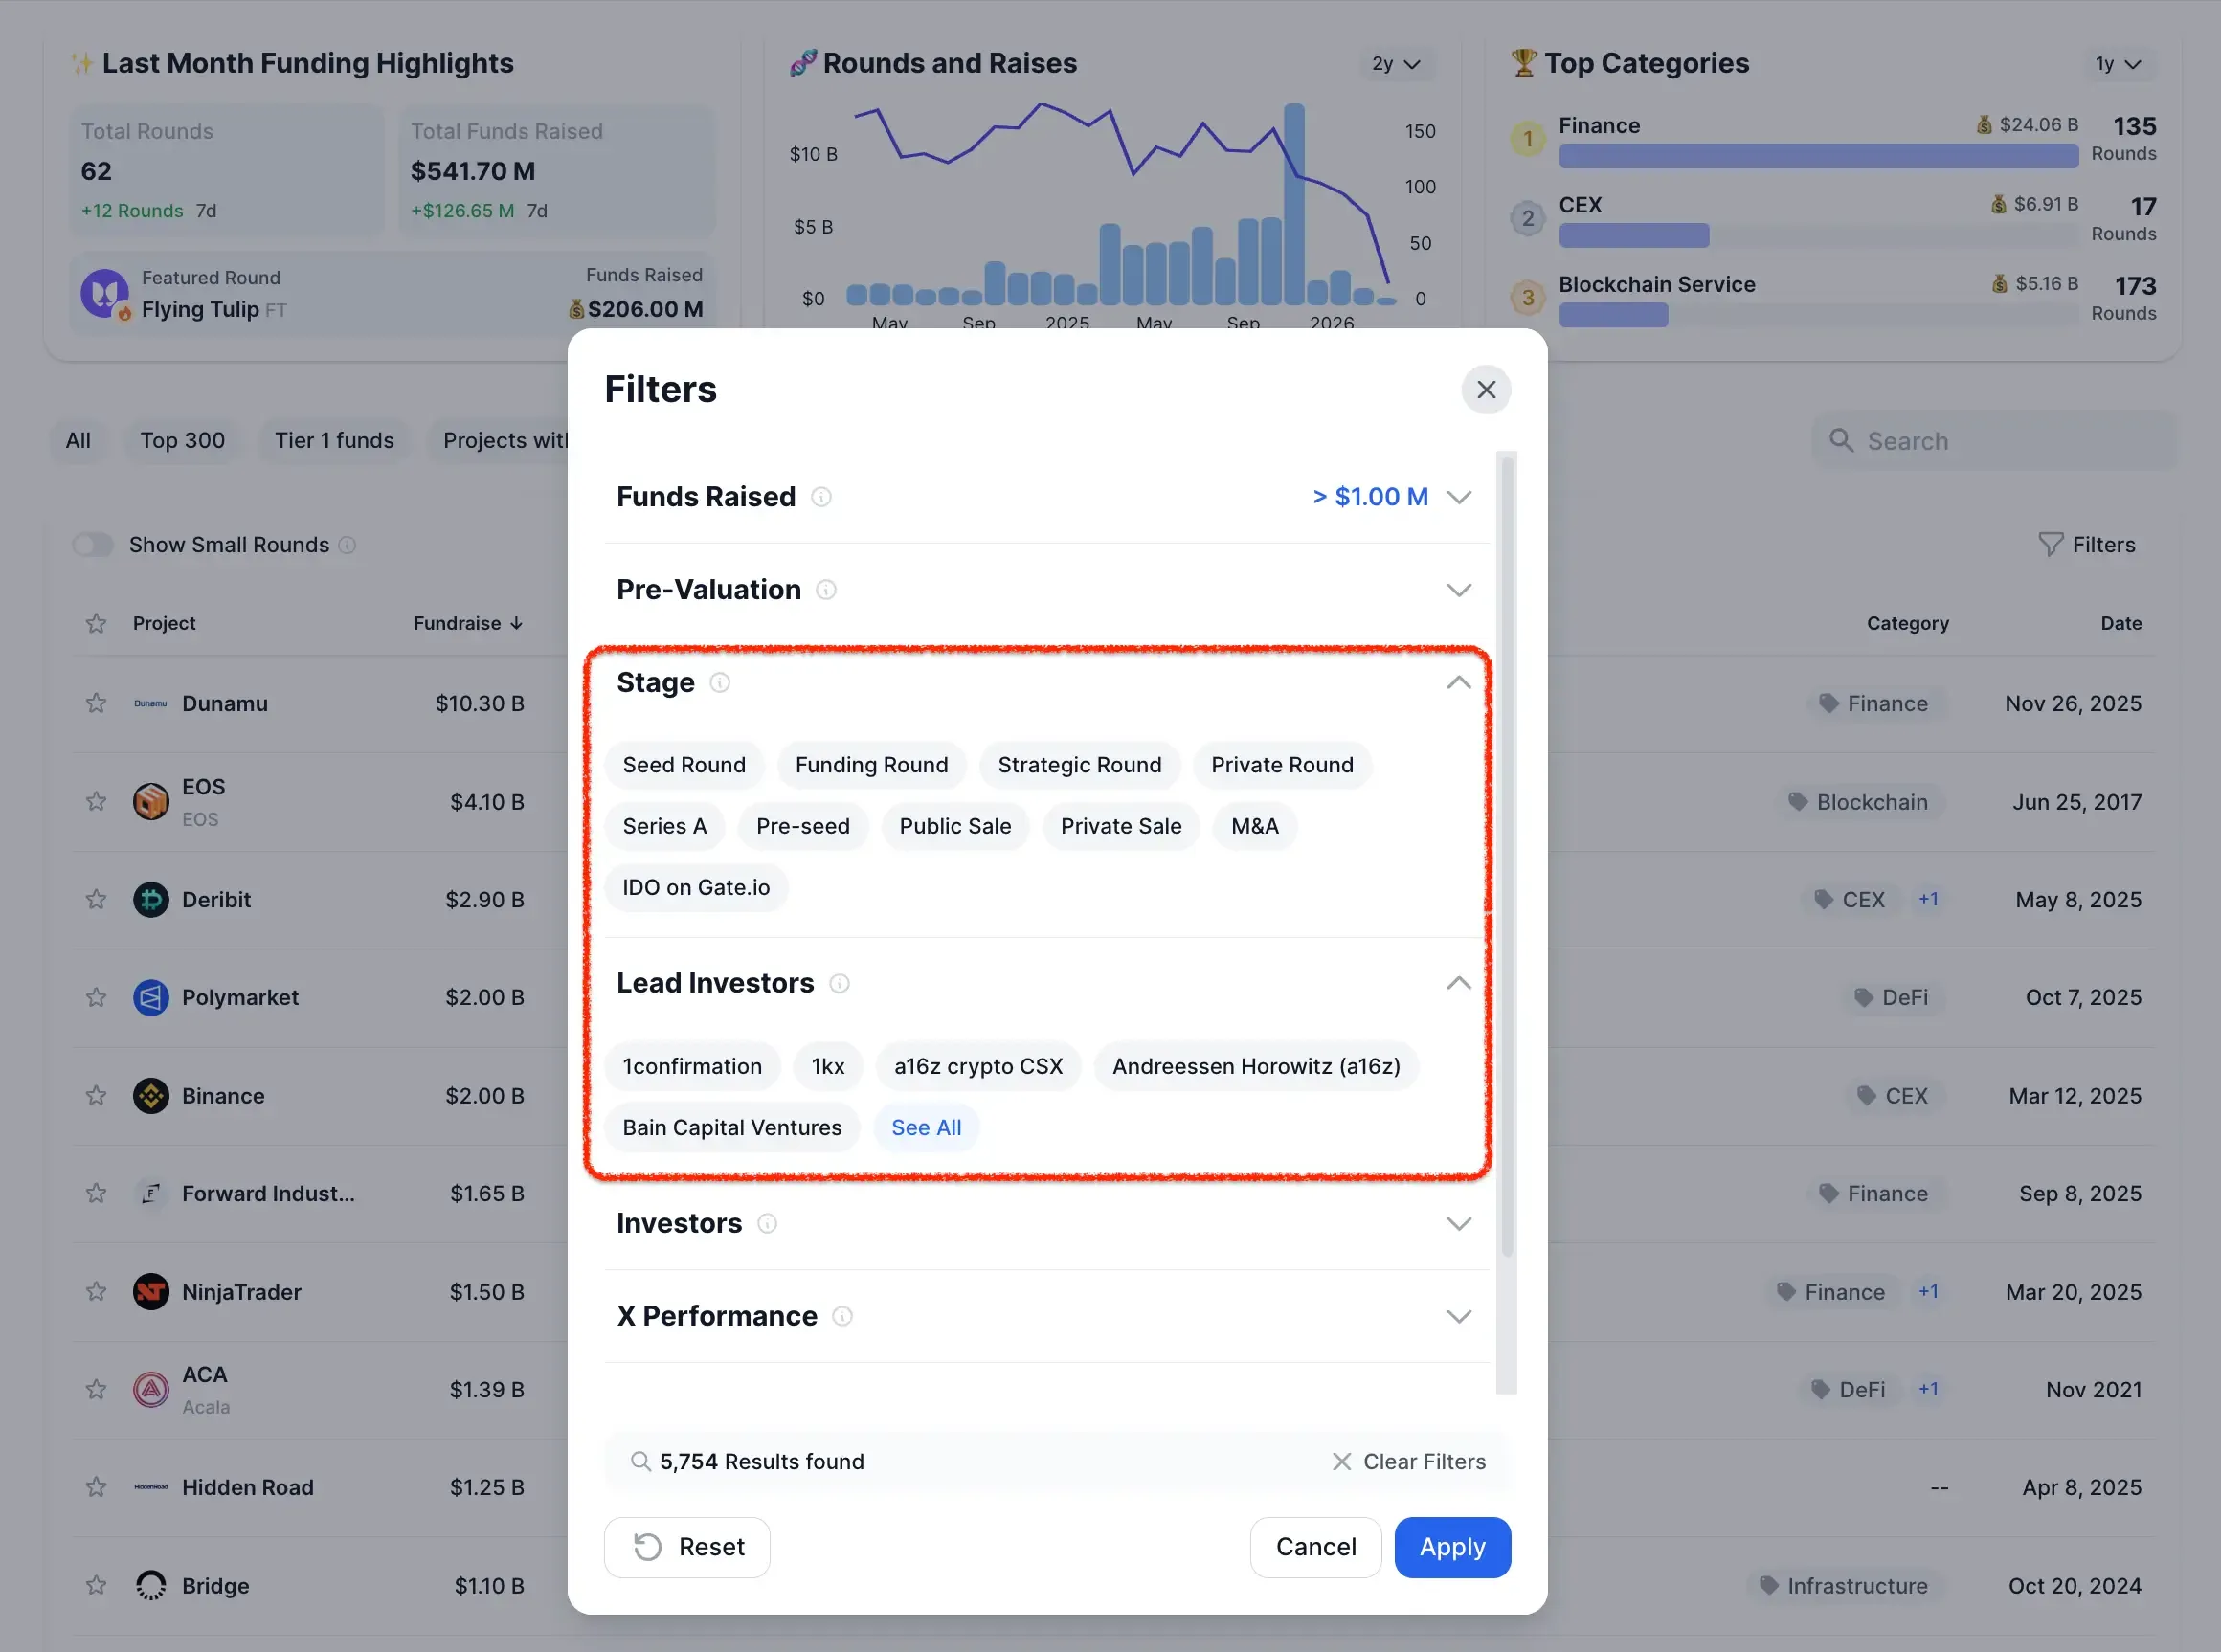
From there, you can tweak the "Stage" and "Lead Investors." Applying these precise metrics ensures you are only spending time looking at projects that actually meet your strict, personalized investment criteria.
Step 3: Analyze the Asset's Individual Funding Tab
Okay, so once you find a project that matches your filter criteria, click into its specific asset page. You'll want to navigate straight to the "Funding" tab.
Take a minute to review all the fundraising rounds chronologically. Make sure to actually expand the largest rounds—this is where you can see exactly which venture funds led the investment, and more importantly, what percentage of the total token supply they managed to secure for themselves.
Step 4: Cross-Reference with Tokenomics
Finally—and you really cannot skip this step—isolate the mathematical disparity between the token's circulating Market Capitalization and its Fully Diluted Valuation (FDV).
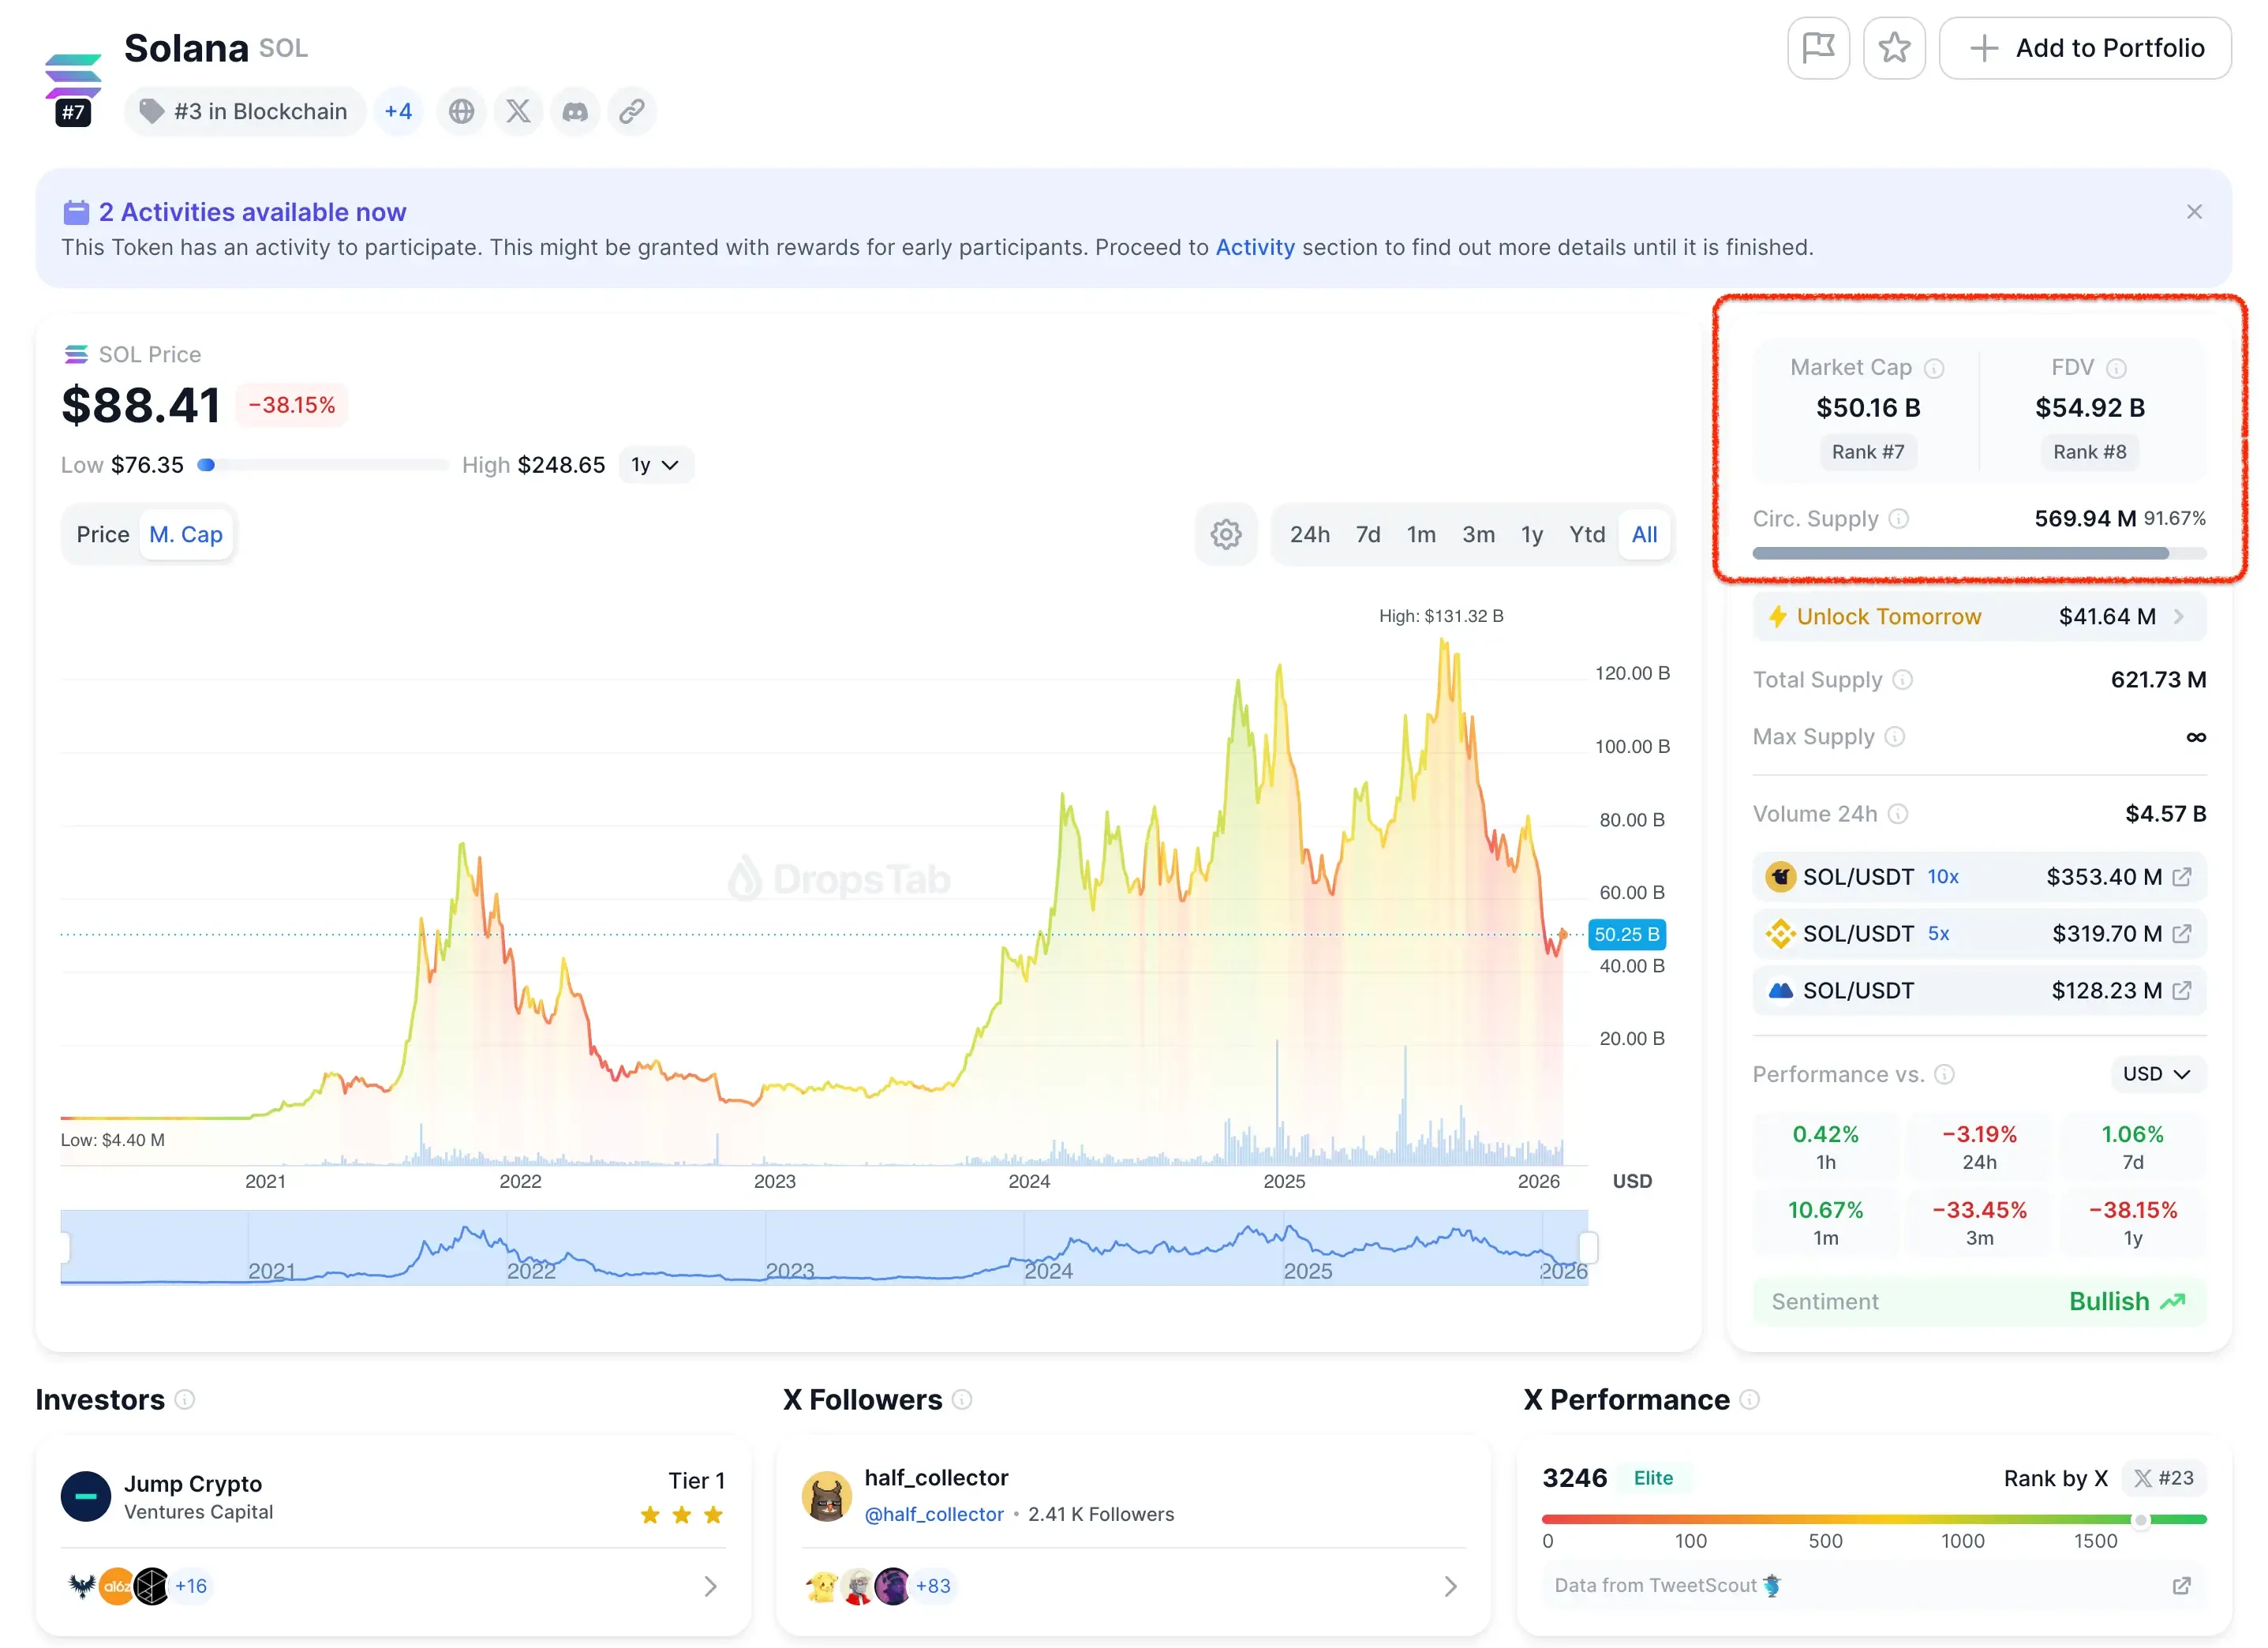
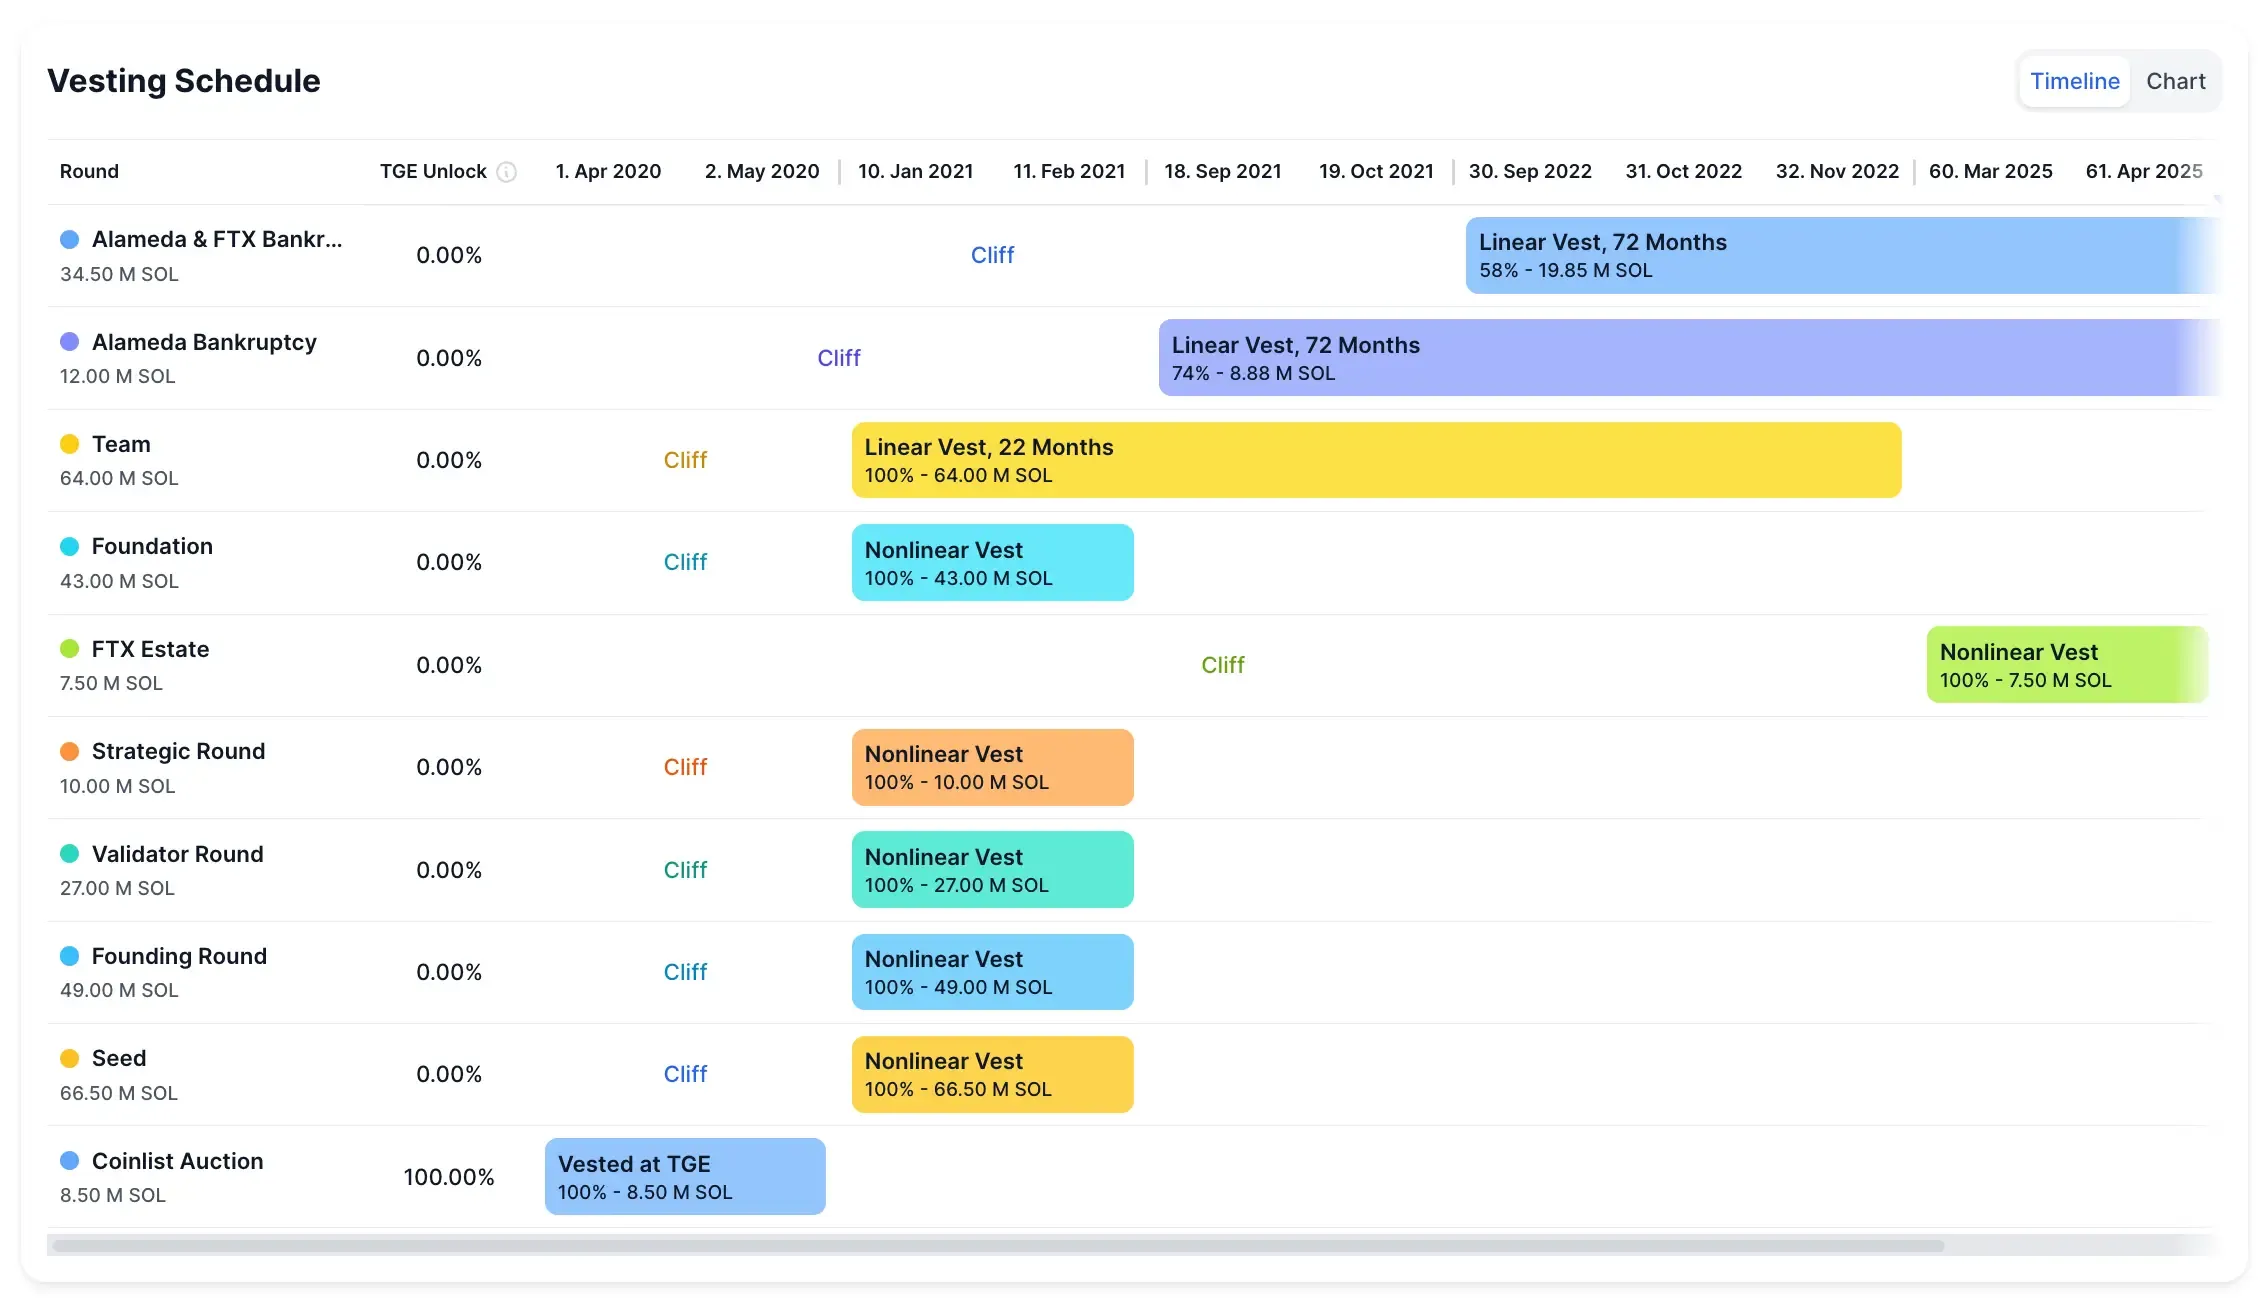
Basically, if the project has a massive FDV but a really low circulating supply (which usually means those VC tokens you just looked at are currently locked), you need to navigate over to the Token Unlocks section.
Look for the big "cliff unlock" dates. These are the days where a massive percentage of the token supply is scheduled to suddenly be released onto the open market. Knowing these dates is crucial; it allows you to anticipate mechanical selling pressure and position your trades accordingly, instead of getting caught off guard by a sudden price drop.
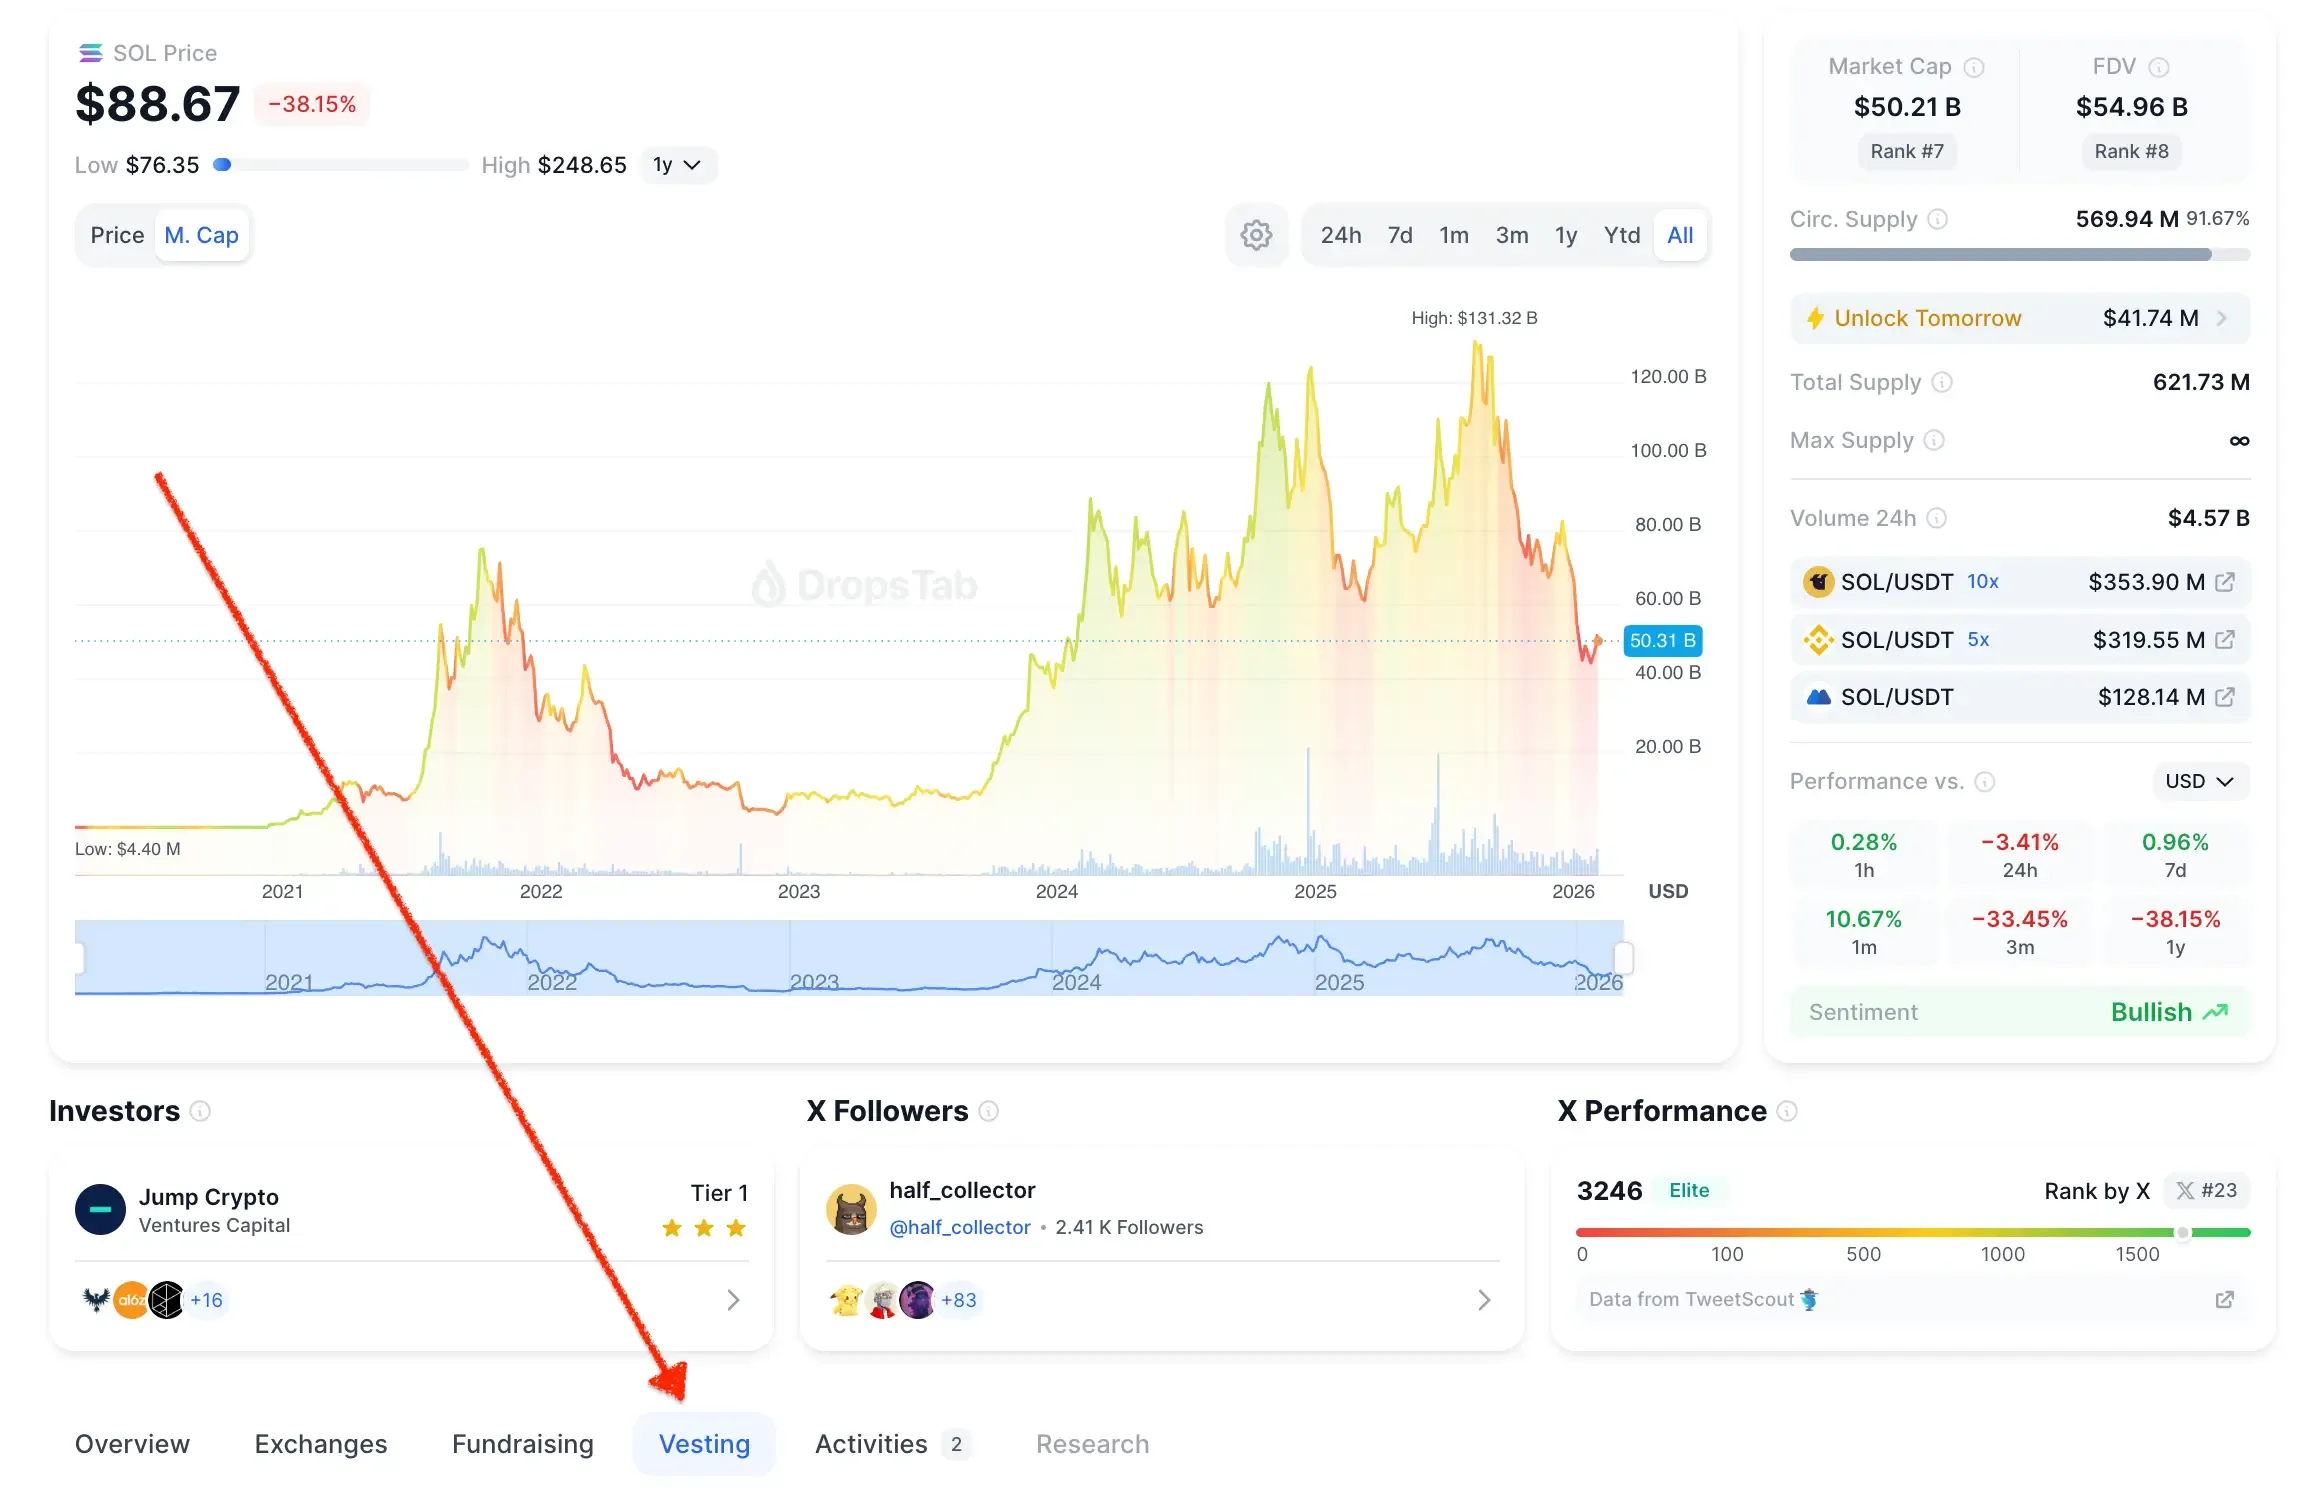
Actually, on that note... if you find yourself staring at the Token Unlocks section and feeling a little overwhelmed by the data—which is totally normal, by the way—you should definitely take a detour and read our other guide:
How to Read Vesting & Token Unlocks on DropsTab
It’s a super helpful read if you want to really master this specific part of your research. In it, we basically break down how vesting charts show you exactly where future supply is coming from, while the unlock tables tell you the exact moment that supply becomes tradable. We also get into the weeds a bit on how large cliffs and heavy insider allocations massively increase your downside risk.
And honestly, if setting up all these filters and checking vesting charts starts to feel like a bit too much all at once, you might want to take a step back and skim our core walkthrough:
What Is DropsTab? The Beginner's Guide
It is a fantastic starting point because it really shows you how to turn all this overwhelming market noise into actual, usable structure. It walks you through using the different tabs to build custom scanners—like spotting VWAP gaps or finding those quiet "accumulation phases" where buyers are secretly scooping up tokens before a breakout.
Conclusion
So, let’s wrap this up. Navigating the crypto fundraising landscape definitely takes a bit more effort than just skimming those flashy VC announcements on Crypto Twitter. It’s easy to get caught up in the hype of a massive raise, but honestly, once you start understanding the broader market shifts—and pairing that context with the tracking tools on DropsTab—you start to naturally filter out all that daily market noise. After a while, checking these metrics actually becomes second nature.
By taking the time to really analyze those historical rounds, expanding the tabs to see who is actually writing the checks, and watching out for those structural tokenomic red flags we talked about, you are basically arming yourself to make actual, data-driven decisions. You stop guessing and start calculating.
"The narrative and a deck era is dead, now revenue is the new pitch." — YashasEdu
Because remember, at the end of the day, the goal isn't just to cheer for whichever project raised the biggest pile of money. The real goal is figuring out exactly how that cash injection is going to impact the token's ecosystem—and your own portfolio—months or even years down the line.