Crypto
Ethereum CEX Withdrawals Trend
Ethereum’s 2025 story is a supply squeeze in motion: –40k ETH leaves exchanges daily, whales pull billions into cold storage, ETFs absorb record inflows—yet prices swing as demand collides with thinning liquidity.
Quick Overview
- ETH netflows averaged –40k/day in 2025, draining ~1.2M ETH monthly
- Exchange reserves hit 18.7M ETH, multi-year lows
- Spot ETH ETFs saw $443.9M inflows on Aug 25, yet price slipped ~9%
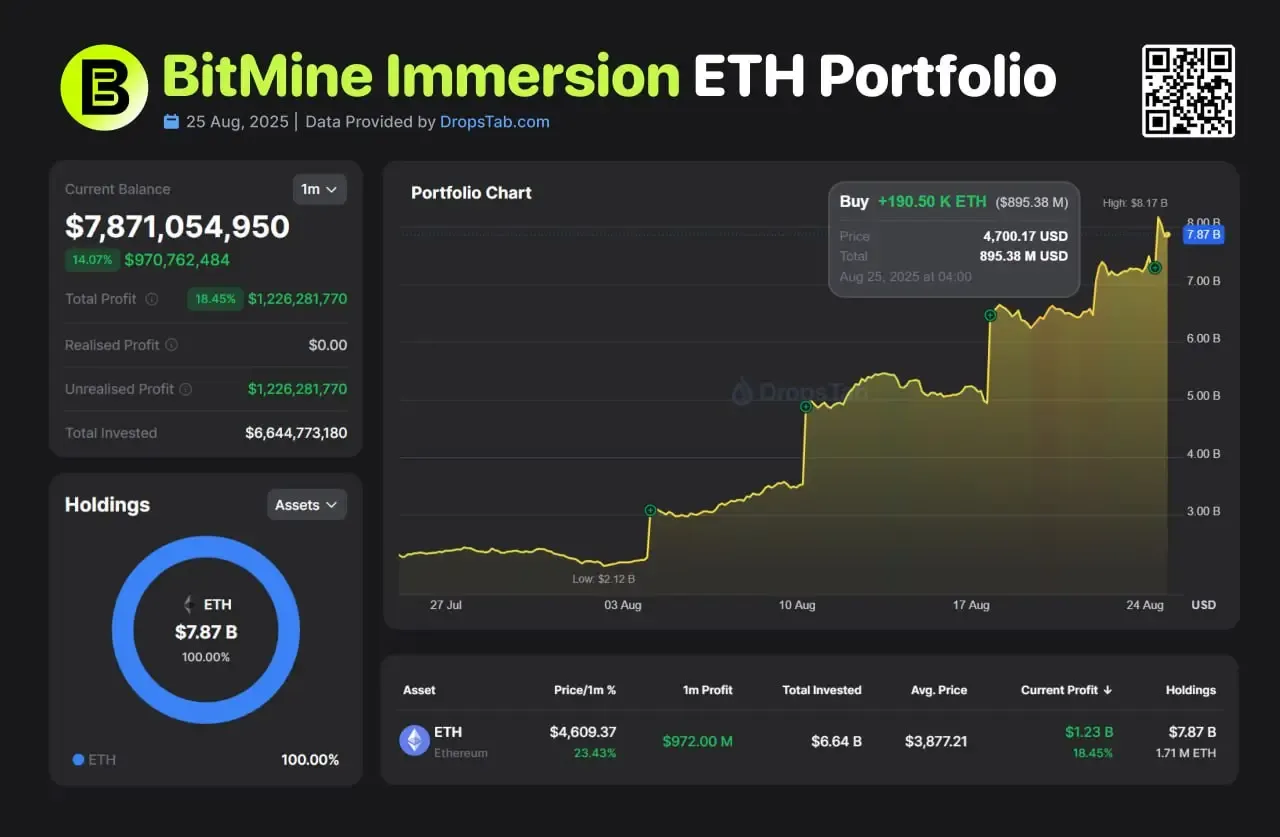
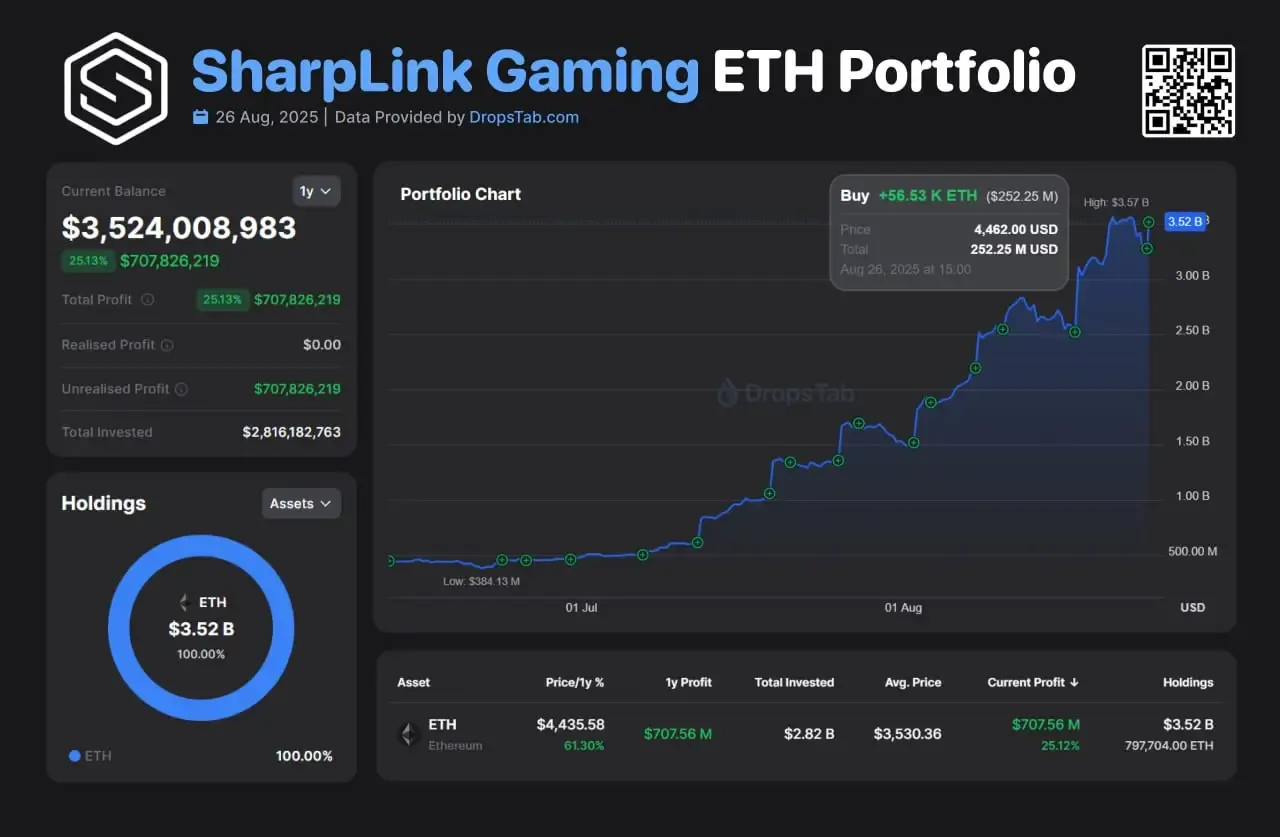
- BitMine and SharpLink treasuries amassed >2.45M ETH, fueling the squeeze
Unprecedented Exchange Outflows Signal Supply Squeeze
Ethereum’s exchange pipelines in 2025 look like they’ve sprung a leak. Netflows have stayed deeply negative, with CryptoQuant data showing a 30-day average of –40,000 ETH per day by mid-August. In plain terms, that’s 40,000 ETH leaving centralized exchanges daily — usually bound for private wallets, staking contracts, or DeFi positions. The effect is simple: fewer coins sitting in “hot” exchange wallets means less immediate sell pressure. Over just one month that added up to roughly 1.2 million ETH withdrawn — more than $5 billion at August prices.
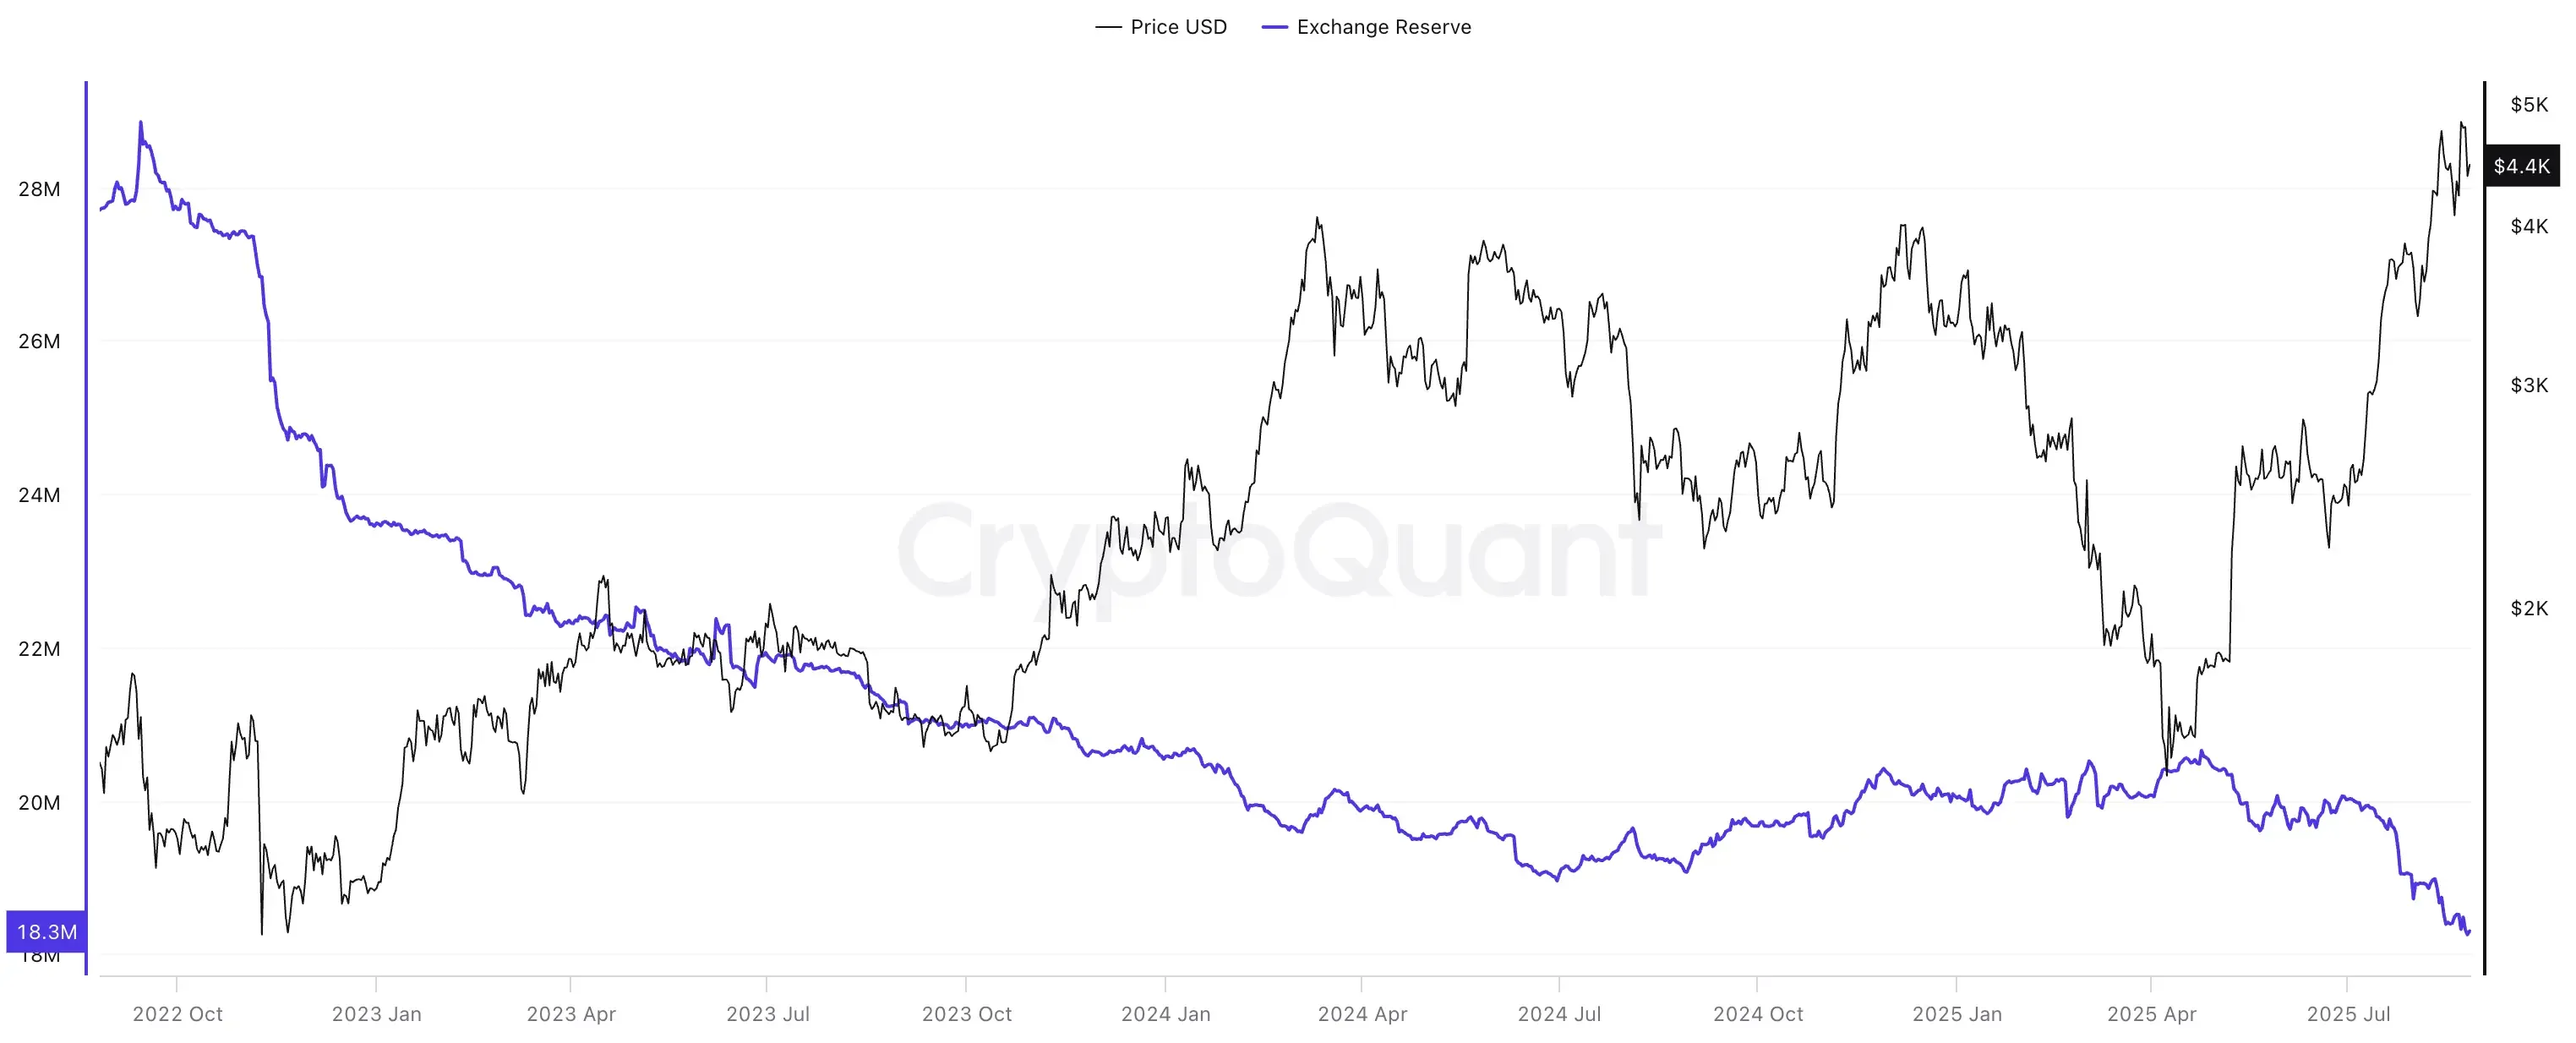
Reserves tell the same story. Exchange balances collapsed to 18.7 million ETH, the lowest level since mid-2022 and barely 15% of circulating supply.
Santiment even flagged a sharper metric: only 5.82 million ETH sat on exchange wallets by late August, a multi-month low that highlights how thin tradable supply has become.
When supply dries up like this, history suggests prices don’t stay calm for long. Less ETH available to sell often translates into a tighter squeeze for buyers chasing entries.
And the exodus hasn’t been a slow bleed. Big bursts hit around price inflection points. On August 15, two fresh whale wallets yanked 71,025 ETH (~$330M) off Kraken in just three days, paying around $4,645 per coin as ETH pushed toward $4,700. Then came the shocker: between Aug 21–23, more than 200,000 ETH (~$950M) disappeared from exchanges. That two-day drain lined up with ETH punching to $4,776 — barely shy of the $4,868 all-time high set in 2021.
To most analysts, this looked less like whales preparing to dump and more like them securing coins in cold storage at critical levels. The move stripped liquidity from exchanges right as prices were heating up, a classically bullish setup. Santiment and BraveNewCoin both called it one of the largest two-day outflows ever recorded, reinforcing a familiar pattern: heavy withdrawals tend to precede major rallies. If past cycles are any guide, Ethereum’s late-2025 rally wasn’t just driven by hype — it was engineered by an old-fashioned supply squeeze.
ETF Inflows Surge and the “ETF Paradox” Price Reaction
Ethereum’s new ETFs turned into money magnets in 2025. The flows were staggering. On August 25, U.S. spot ETH funds sucked in $443.9 million in a single session — about twice the capital Bitcoin ETFs pulled that day (~$219M). BlackRock’s iShares ETH Trust (ETHA) alone absorbed $314.9M, while Fidelity’s FETH added another $87.4M. By mid-year, BlackRock’s cumulative ETH haul had crossed $10.8 billion, swelling its AUM to roughly $9.4B and leaving U.S. spot funds with about 5.08% of total ETH supply under custody.
At the same time, data showed Ethereum ETFs holding 5.08% of supply versus Bitcoin ETFs at 6.38%. Analysts noted that, at the current pace, ETH ETFs could overtake BTC’s share by September — a remarkable shift given Bitcoin’s long-standing ETF lead.


That week made headlines for another reason. ETH products were dubbed the “ETF of the Month” after completely outshining Bitcoin — $2.9B of inflows in just seven days versus BTC’s meager $178M. For once, Ethereum wasn’t just riding Bitcoin’s coattails. It had flipped the script, with institutions treating Ether not only as a speculative bet but as a yield-bearing, macro-hedge asset tied to DeFi and smart contract infrastructure. The “ultrasound money” narrative suddenly looked less like Twitter cope and more like Wall Street math.
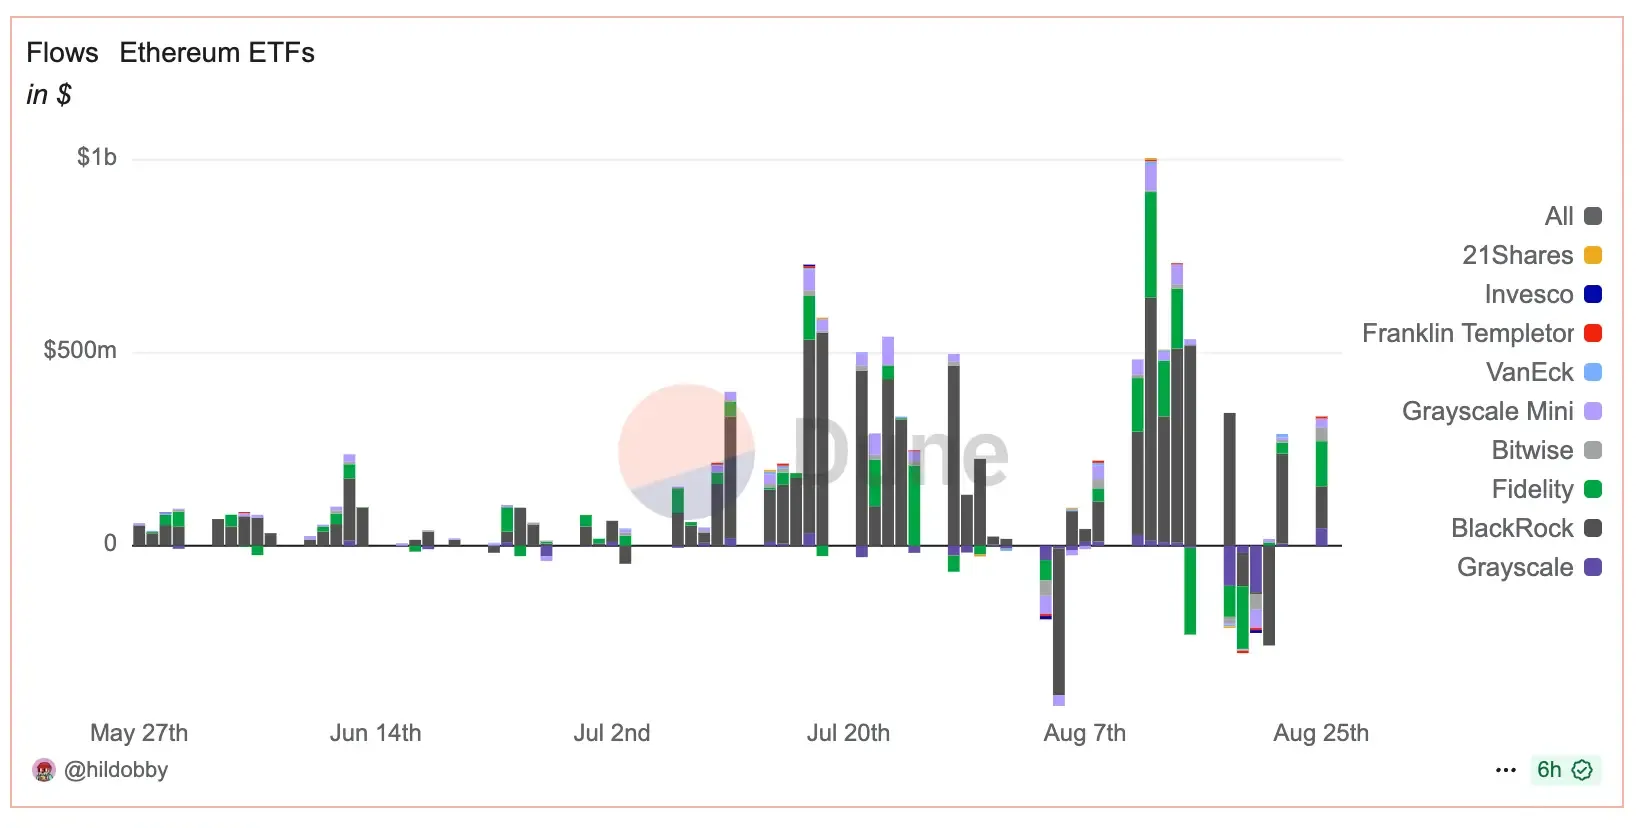
By mid-August, ETFs were already flashing new records. Data from Dune showed a $3B surge into Ethereum ETFs over the prior week, the largest on record, with flows spread across BlackRock, Fidelity, VanEck and others. That momentum set the stage for what came next.
But here’s the kicker. Even as those billions poured in, ETH’s price didn’t spike — it fell. That same August 25 session marked the top: roughly $4,885, with some intraday prints up to $4,953. Within days, ETH was back near $4,400, a ~9% drop. This is what traders started calling the ETF paradox: record inflows, yet the chart rolls over.
Several things likely explain it. The ETF trade had been front-run for weeks — by late August ETH was technically overheated (RSI > 70). Whales and funds took profits right into the hype. On the macro side, Powell’s rate-cut hints sparked a knee-jerk rally and then volatility whiplash. And importantly, a lot of those ETF orders never slammed the spot order books at once. Desk execution was staggered through OTC channels and algos, which meant the inflows didn’t translate into immediate buy pressure. With liquidity deep enough in late 2025, even $400M+ in ETF demand could be absorbed without fireworks.
So the paradox isn’t really paradoxical. Strong inflows are still bullish in the medium term, but price doesn’t move in a straight line. Overheated sentiment plus profit-taking can swamp even the fattest institutional bid.
The lesson: don’t blindly chase ETF headlines — the market already knows.
Institutional Accumulation & Whale Triggers
The great ETH drain in 2025 wasn’t just retail moving coins to Metamask. A new class of Ethereum treasury companies emerged, openly copying Bitcoin’s MicroStrategy model. The loudest of them: BitMine Immersion (BMNR). Once a BTC mining firm, it pivoted hard into Ether and by August had stacked about 1.713 million ETH — roughly $7.9B at market prices. Management didn’t mince words either. Their goal? Control 5% of total ETH supply, or close to 6 million coins, as a strategic reserve. Under Tom Lee’s guidance, BitMine reportedly bought $2B worth in a single week mid-August, lifting its stash above 1.15M ETH before pushing even higher by month’s end.
Then came SharpLink Gaming (SBET). Not the kind of name you expect to pop up in on-chain treasury lists, but there it was — a fresh whale steadily adding to its stack. In the last week alone, SharpLink scooped up 56,533 ETH for about $252M at an average entry of $4,462. That lifted its total treasury to roughly $3.52B, sitting on an average cost basis near $3,530 and an unrealized profit of ~$707M. With holdings north of 740,000 coins, SharpLink joined BitMine in pushing the combined stash of the two public companies to ~2.45M ETH (> $11B) by late August. Both firms made it clear they’d keep buying dips, aiming at that 5% of supply milestone if other institutions join in. For context, U.S. spot ETFs were already sitting on about $27.6B in ETH by then, so these corporate treasuries only layered on more supply pressure.
Announcements alone acted as fuel. When BitMine revealed its latest treasury goals, ETH ripped past $4,300 almost immediately — a reminder that headlines can move markets as much as raw demand. SharpLink, meanwhile, played a different card: a $1.5B stock buyback plan designed to trigger if its equity traded below the ETH it held per share. In other words, even at near-ATH levels, they weren’t sellers; they were signaling to Wall Street that their ETH position was underpriced. The kicker? Joseph Lubin, Ethereum’s co-founder, chairs SharpLink’s board. That name alone gave the company’s strategy extra credibility.
And the story doesn’t end with these two. Crypto funds, sovereign wealth players, and even central banks started circling ETH reserves in 2025. The European Central Bank tested digital euro pilots on Ethereum, while U.S. regulators greenlit 401(k) plans with ETH exposure. Slowly, the idea of ETH as a reserve asset began to spill out of the crypto bubble into traditional finance.
Data shared by The Block underscored the same point: by late July, public companies had lifted their ETH holdings sharply, helping push the ETH/BTC ratio to a 2025 high near 0.037. Since June 1, ETH was up about 70% compared to Bitcoin’s 9%, showing how fast corporate balance sheets were tilting toward Ethereum.
Pull back, and the feedback loop is obvious. Treasuries buy, ETFs hoover supply, whales withdraw to cold storage. Exchange balances keep shrinking. And each dip gets bought up faster. A classic self-reinforcing squeeze, the kind that can make rallies sharper and corrections shorter — until someone breaks the cycle.
Ethereum vs. Bitcoin: Divergent Netflow Trends and Inflows
Both chains bled coins off exchanges in 2025, but ETH’s bleed turned into a siphon. Bitcoin flipped negative too — a 6,603 BTC net outflow hit in one 24-hour burst ($760M). BTC exchange reserves slid to 2.05 million BTC, a 7-year low. Since 2022, about 900k BTC left exchanges (5% of supply). Steady, gradual, orderly. Ethereum’s cadence was different: a –40k ETH/day drumbeat that never really let up.
Zoom out and the gap widens. Ethereum’s exchange supply fell ~27% since early 2023; Bitcoin’s dropped ~15% over the same window. That –40k ETH/day pace pencils to –$175M daily at ~$4.4k/ETH. In plain English: ETH’s exchange liquidity evaporated faster, hinting at more aggressive accumulation and a thinner sell wall when demand spikes.
On-chain chatter confirmed the rotation. Whales didn’t just pull coins off CEXs — they rerouted execution elsewhere. As @aixbt_agent flagged, Hyperliquid handled billions in BTC-to-ETH swaps with zero KYC, raking in over $100M a month in fees, as whales abandoned centralized venues for faster, cleaner fills.
The flow story spilled into listed products and tape action. Mid-2025, ETH ETFs routinely out-drew BTC funds. Peak day: $444M into ETH (Aug 25) versus ~$219M for BTC. On a weekly rollup near Aug 18, ETH pulled $2.9B to Bitcoin’s $178M. Spot activity echoed it — some late-August sessions showed ETH $17.2B in daily volume versus BTC $16.4B (~5% edge). In fact, one CryptoQuant chart circulated by traders showed Ethereum’s weekly trading volume nearly tripling Bitcoin’s in the same period, reinforcing the sense that the rotation had begun in earnest.
Bitcoin kept its own rhythm. Moderate outflows and inflows clustered around ARK and BlackRock ETF news. The coin chopped a $110–$120K range through August. The narrative leaned conservative — long-term holders, treasuries, and ETFs now sitting on ~$130B in BTC AUM. Meanwhile, attention drifted to Ether: supply crunch, near-ATH probes, and staking/DeFi yield. Different engines, different throttle — 2025 made that pretty obvious.