Crypto
Ethereum vs Bitcoin: ETF Inflows and Market Reactions
Ethereum and Bitcoin rallies in 2024–2025 show a clear pattern: massive ETF inflows ignite price surges, while sustained outflows often mark the top—making fund flow trends the key signal for traders and analysts.
Quick Overview
- ETH’s 2025 rally was fueled by ETF inflows rising from ~$0.4B in June to $2.27B in August, driving price from ~$1,519 to ~$4,739.
- BTC saw two ETF-driven surges: early 2024 inflows up to $2.57B and late 2024 record inflows of $3.38B, leading to ATHs of $101k and $124k.
- ETH’s ETF cycle lags BTC’s by ~6 months but delivered a slightly stronger gain (+215% vs BTC’s +198%).
- BTC rallies proved highly sensitive to ETF outflows, while ETH has yet to face a sustained outflow phase.
- Both assets historically peak when inflows dry up or multi-week outflows emerge, making flow data the key risk signal.
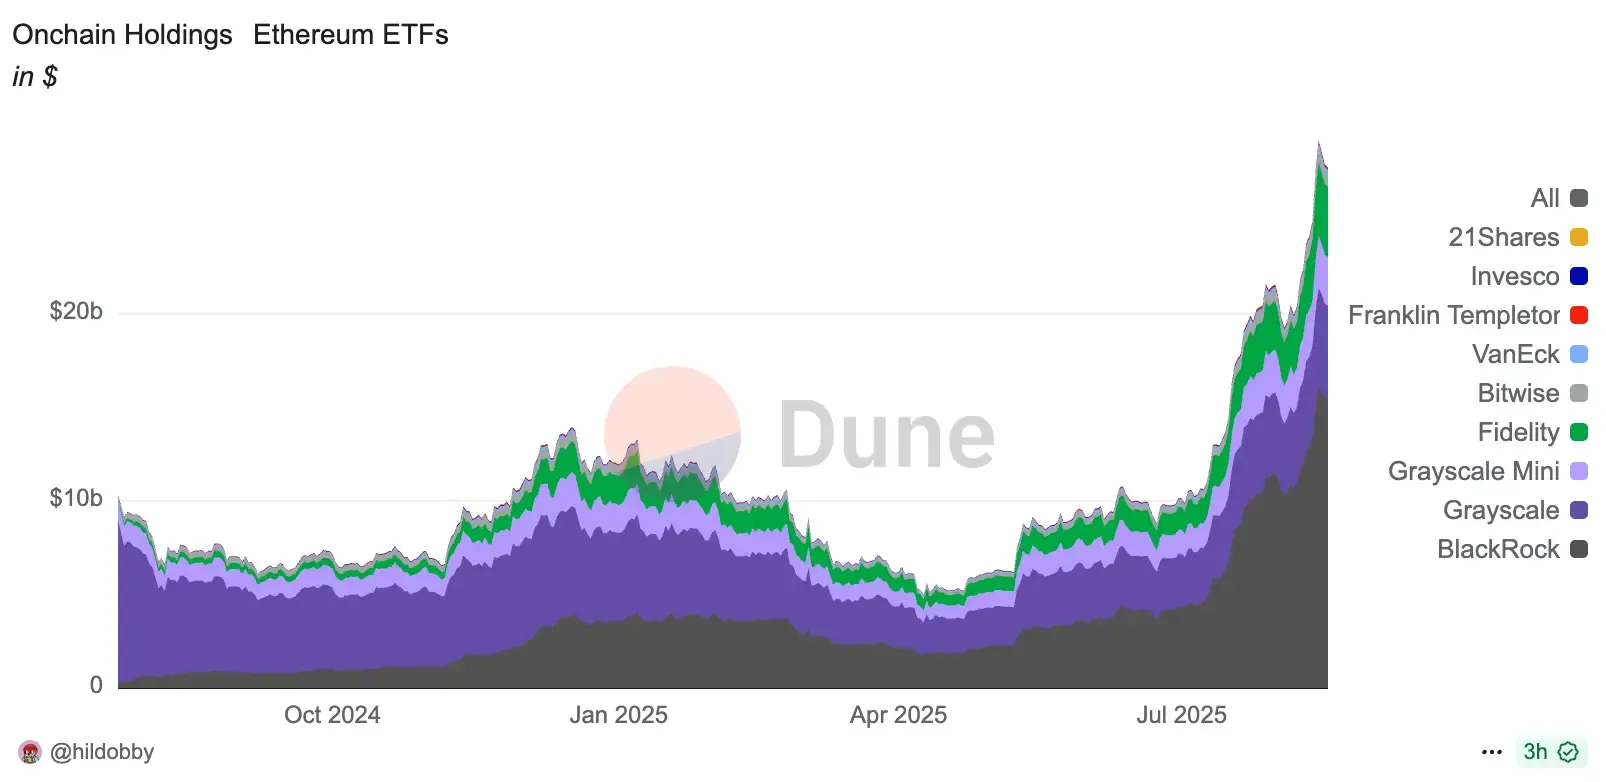
ETH: Summer 2025 Pump and the Role of ETF Inflows
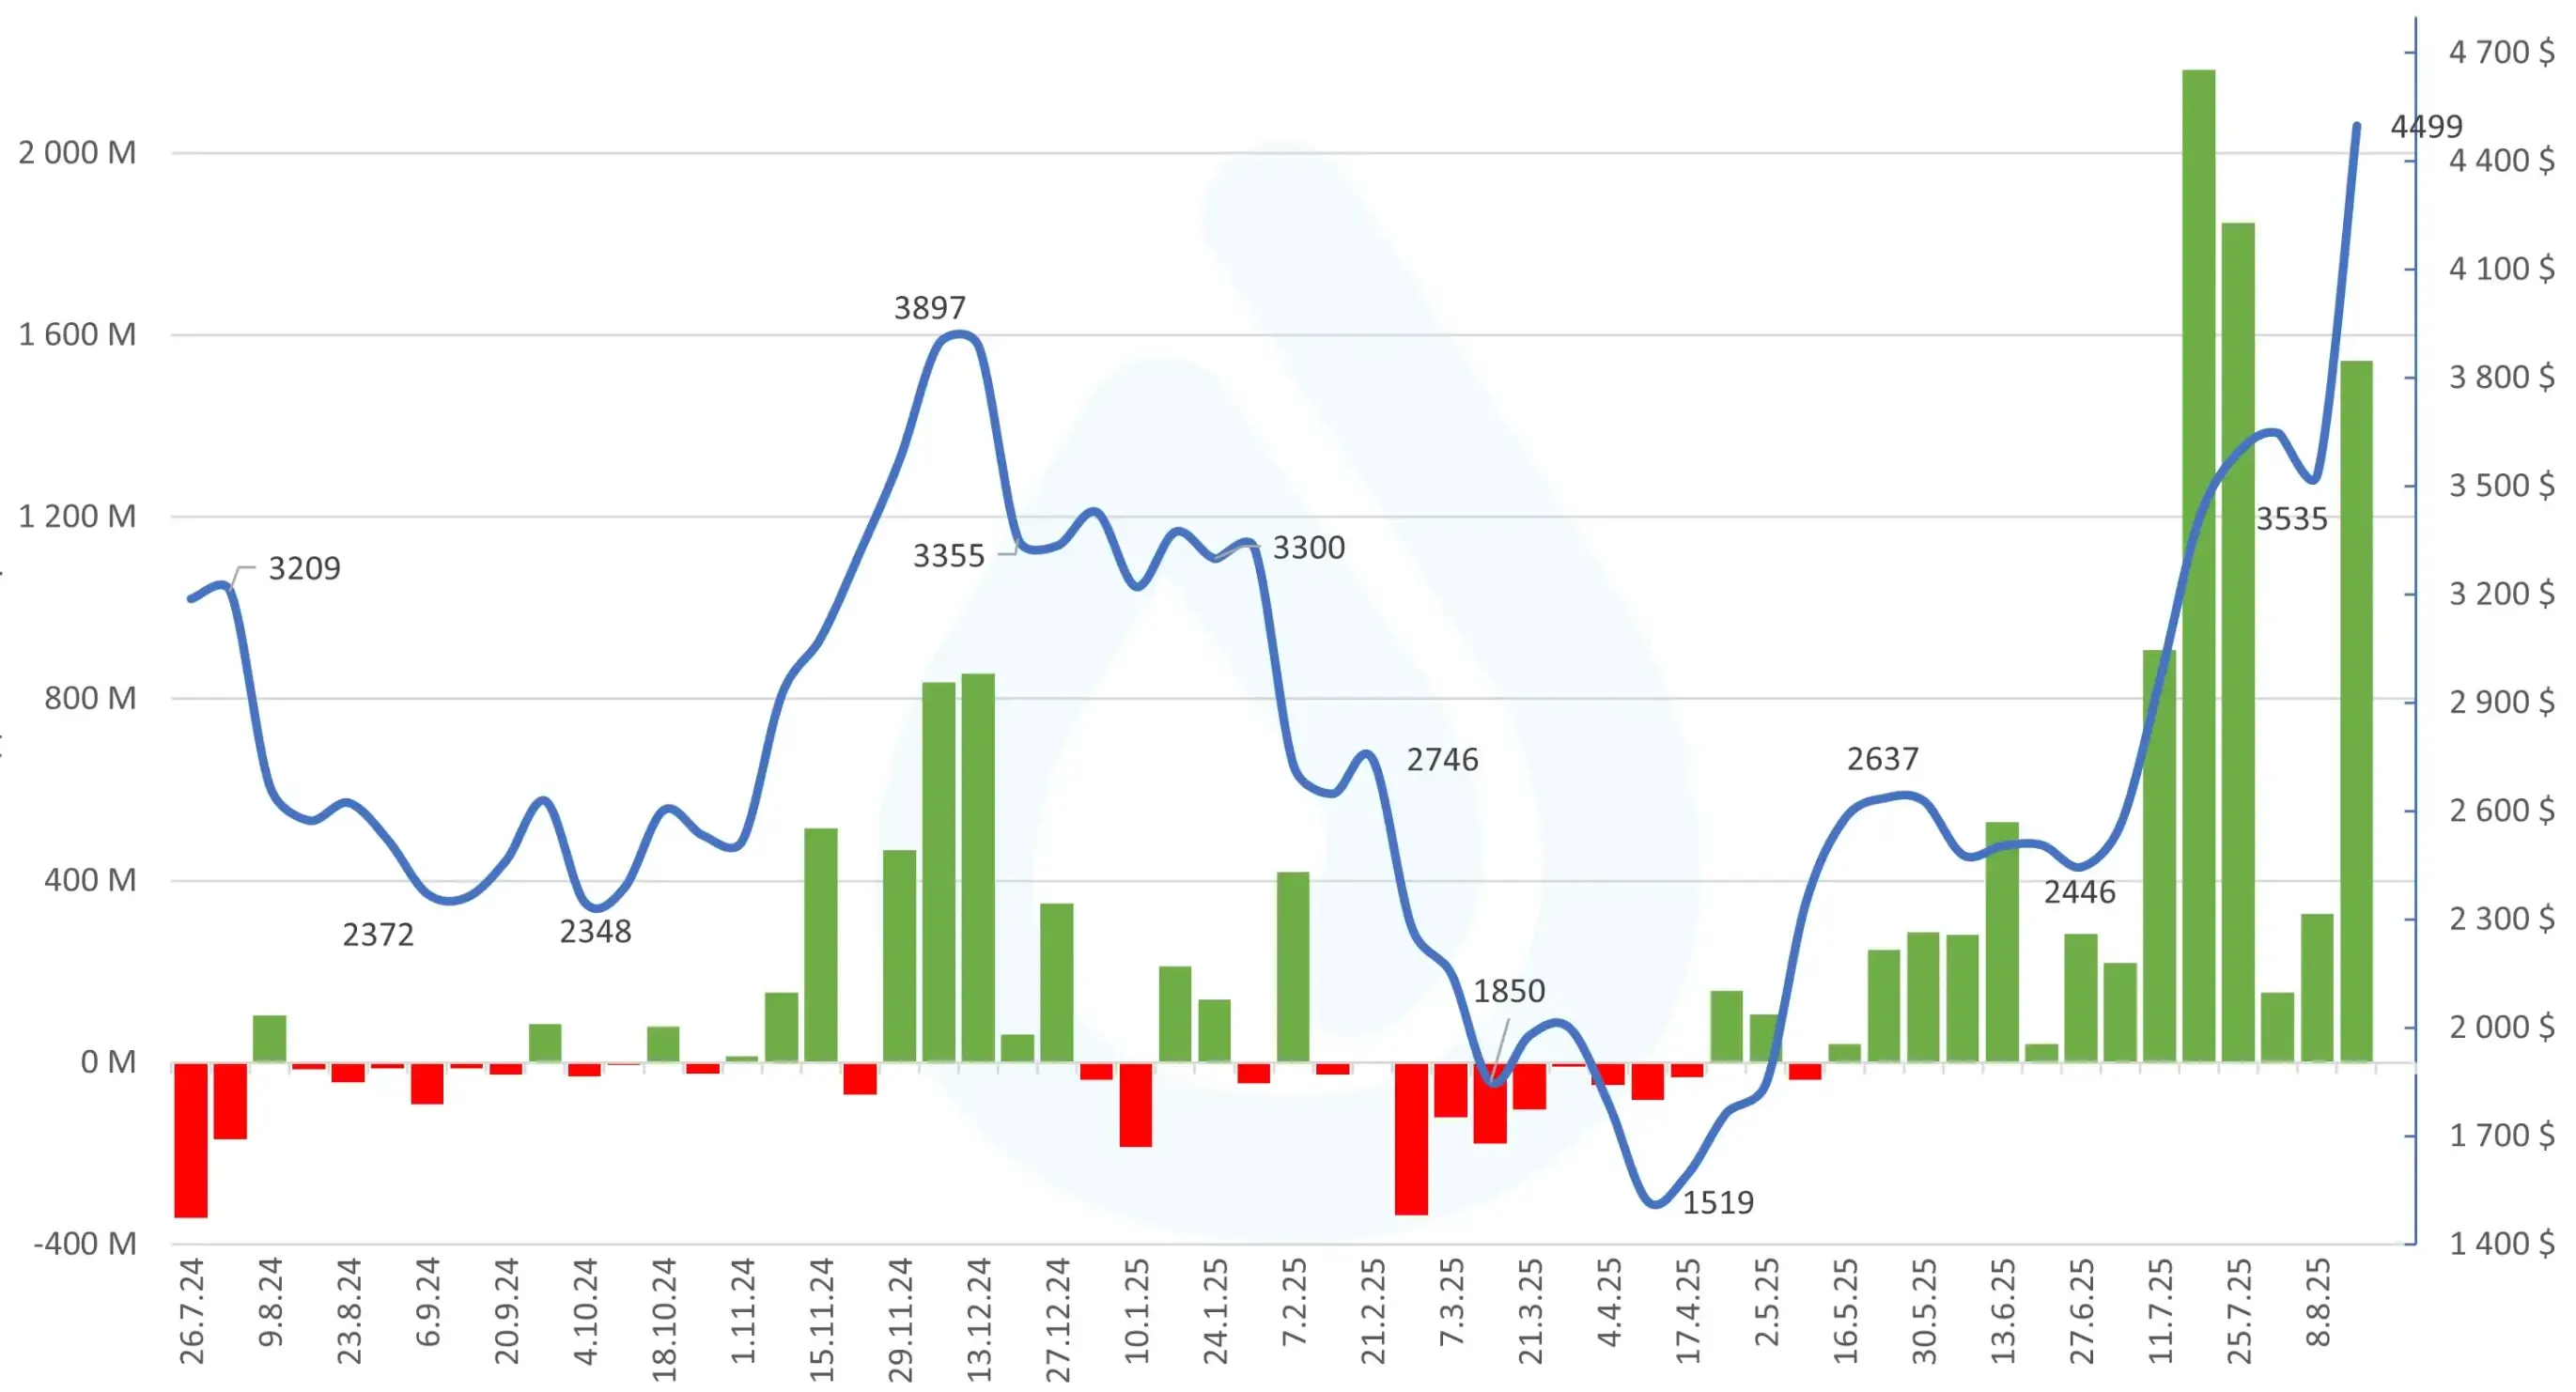
Starting mid-2025, spot ETH ETFs saw surging demand that coincided with a parabolic price move. Weekly inflows climbed steadily from roughly $0.4B in mid-June to record levels by August.
For example, the week ending July 18, 2025 saw $2.18B net inflows, sending ETH above $3,400. The following week (Jul 25) brought $1.85B inflows and a break above $3,500. On July 29, 2025, market attention also spiked after reports that the SEC acknowledged a BlackRock filing to permit staking for its spot Ethereum ETF — a potential structural shift that added to the inflow momentum:
By mid-August, net inflows hit $2.27B (week ending Aug 15) – the largest yet – and ETH surged to ~$4,738. Around the same time, on August 15, blockchain data revealed that BlackRock purchased roughly $500M in ETH, underscoring how institutional accumulation paralleled retail selling pressures — further amplifying ETF-driven demand:
In total, ETH’s price jumped from ~$1,519 in April 2025 to ~$4,739 in mid-August 2025 (≈+215%). These flows created “waves” in the price chart: each spike in ETF net buying precipitated a new high. Before this, ETH had traded roughly $1.5–3.3k for months; the influx of ETF capital in summer 2025 was clearly the catalyst for the breakout. Part of that stagnation was tied to liquidity stress in staking markets — when stETH briefly lost peg after Justin Sun withdrew $518M from Aave, spiking borrow rates and pushing Ethereum’s validator exit queue to a record 625k ETH, as covered in a detailed analysis of the event.
In short, the ETH summer bull-run was tightly linked to ETF demand: peak weekly inflows exceeded $2B and coincided with ETH making fresh highs. This dynamic suggests institutional ETF buying was a primary driver of the rally. Earlier in 2025, ETH ETFs had seen mixed flows and the price remained rangebound; only when consistent, large inflows arrived did ETH begin its steep climb.
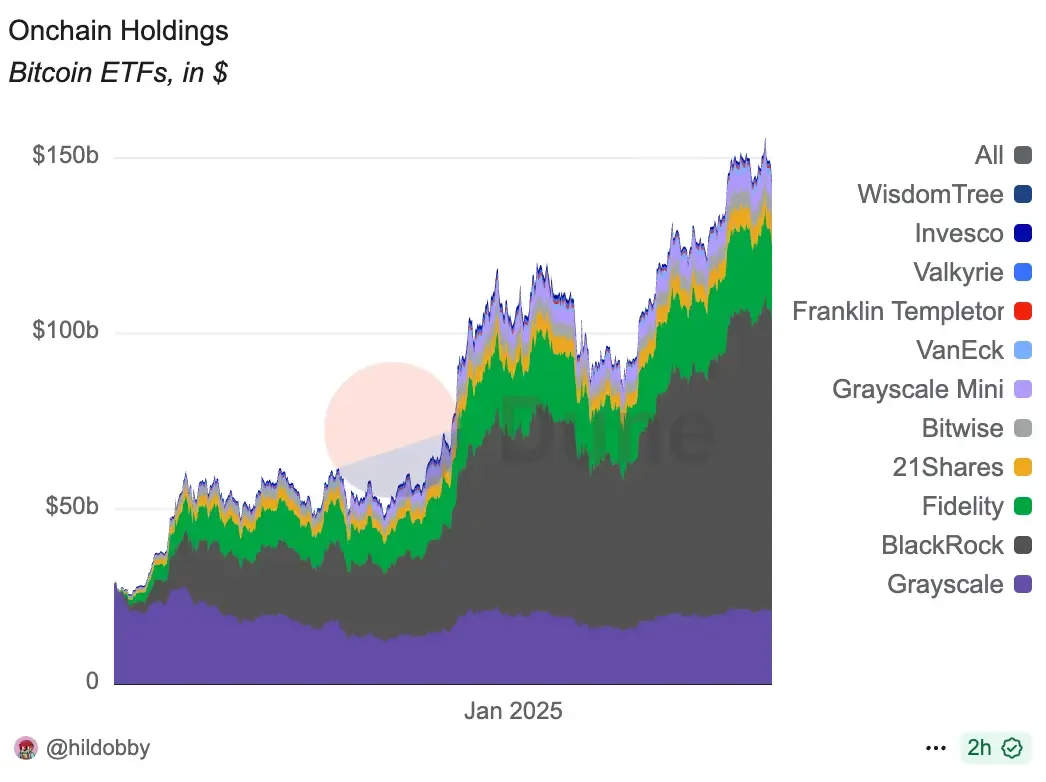
BTC After ETF Launch
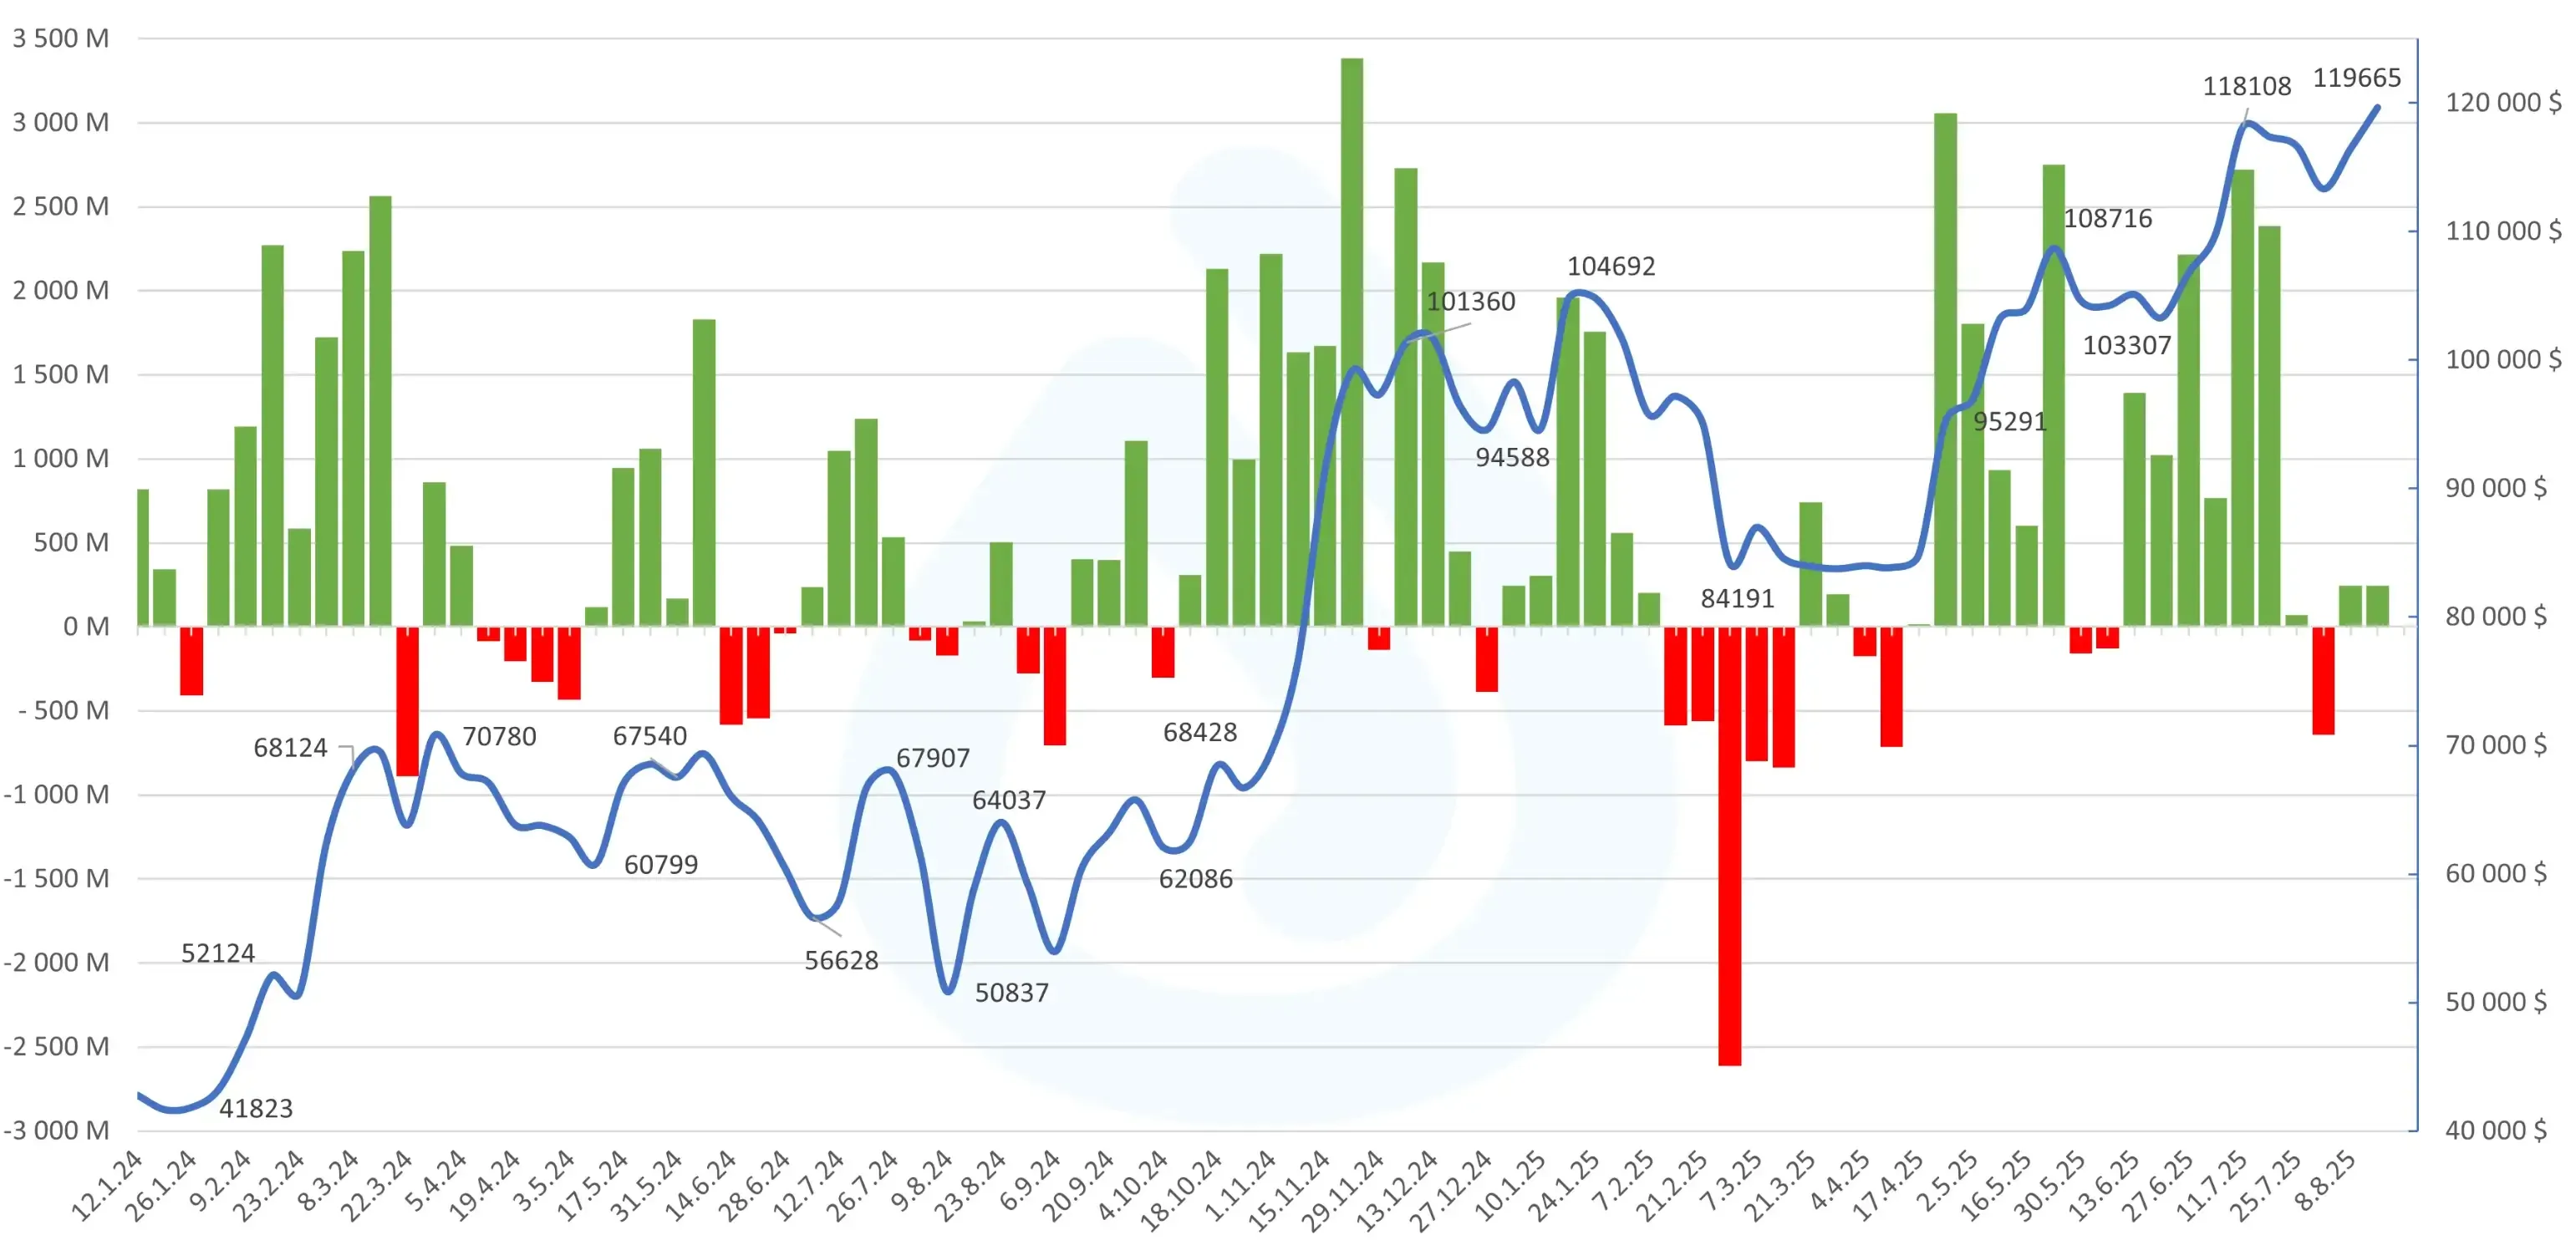
Bitcoin’s ETF story began in January 2024. Following U.S. SEC approval of spot BTC ETFs, the first months saw historic inflows. For instance, the week of Feb 16, 2024 recorded about $2.27B net inflows into BTC ETFs, and the week of Mar 15, 2024 about $2.57B. These massive injections helped lift BTC from ~$41,823 in early January to roughly $73,000 by late March 2024.
After March 2024, BTC entered a consolidation period. Flows alternated between modest positive and negative weeks, and price stalled without a clear trend for several months. The next leg up began in late 2024: in the week of Nov 22, 2024 BTC ETFs saw about $3.38B net inflow – the largest on record. This inflow wave (coinciding with broader bullish sentiment) drove Bitcoin to a new all-time high around $101,360 in January 2025.
Once into 2025, the cycle repeated. February–April 2025 saw sustained outflows from BTC ETFs (for example April total ~–$0.81B). This ETF selling pressure correlated with a pullback: BTC dipped to about $84,150 by mid-April. Then in May–July 2025, inflows returned: e.g. a ~$3.05B buying week (late April) and a ~$2.72B week (mid-July) coincided with BTC powering to about $118,108 in mid-July. Ultimately, August 2025 saw a new BTC ATH near $124,474, even as ETF inflows had dwindled to just ~$0.1–0.3B per week in late July/Aug.
In summary, Bitcoin’s bull phases came in two distinct ETF-driven waves: early 2024 and late 2024. Each wave was kickstarted by record inflows into BTC ETFs and saw prices nearly triple from their cycle lows. Conversely, intervening periods with neutral-to-negative ETF flows often coincided with range-bound or declining prices.
ETH vs BTC: Timing, Scale, AUM, Price Reaction, and Corrections
The comparison below highlights how ETH and BTC ETFs differ across key dimensions:
First ETF surge
- BTC: Jan–Mar 2024, weekly inflows ~$2.27B (Feb 16) & ~$2.57B (Mar 15).
- ETH: Dec 2024–Aug 2025 (lagging ~6 months), with July–Aug 2025 peak weekly ~$2.27B (Aug 13).
Second surge
- BTC: Nov–Dec 2024, record ~$3.38B inflows (Nov 22).
- ETH: Not yet observed; current cycle still unfolding.
Peak weekly inflow
- BTC: $3.38B (Nov 2024).
- ETH: $2.27B (Aug 2025).
ETF Assets Under Management (AUM)
- BTC: 1.292M BTC ($158.6B), ≈6% of circulating supply.
- ETH: 6.3M ETH ($29.7B), ≈5.1% of circulating supply.
% of supply in ETFs
- BTC: ~6%.
- ETH: ~5.2%.
Price percentage gain during ETF cycle
- BTC: +198% (from $41,823 in Jan 2024 to $124,474 peak).
- ETH: +215% (from $1,519 in Apr 2025 to $4,783 peak).
Sensitivity to outflows
- BTC: Highly sensitive – drawdowns coincided with ETF outflows. Negative weeks repeatedly signaled corrections.
- ETH: Untested so far – ETH has not yet faced multi-week net outflows in the ETF era.
ETH’s ETF cycle appears to mirror BTC’s with ~6 months lag; ETH’s price has risen slightly more (215% vs 198%) in its recent rally. Peak BTC inflows were larger (3.38B vs 2.27B), reflecting larger AUM. On balance, BTC ETFs hold roughly twice the assets of ETH ETFs (USD terms). Crucially, both assets historically see a market top when multi-week ETF outflows emerge or inflows suddenly dry up. BTC’s tops (e.g. Feb–Apr 2025) coincided with sustained outflows. By contrast, ETH to date has seen continuous inflows (14 weeks straight) – a sign that the “exhaustion” phase has not yet arrived for ETH ETFs.
As analysts have pointed out, the price structures of ETH and BTC look strikingly alike — each rally driven by ETF inflows, each correction triggered by flow slowdowns. One widely shared chart on August 15 highlighted the near-identical trajectories of the two assets, underlining how Ethereum is closely shadowing Bitcoin’s ETF playbook:
Implications and Risk Scenarios
Both Bitcoin and Ether have shown a recurring pattern: extended ETF inflows fuel rallies, and multi-week outflows often mark tops. In BTC’s case, every major top was preceded by weeks of net selling by ETF holders. For example, after the Jan 2025 ATH, February–April saw consecutive weekly outflows (~$0.1–0.3B per week, totaling $812M in April alone), and BTC fell back to ~$84k. Similarly, the late-2024 BTC peak was followed by a brief outflow period in Nov/Dec that paused the rally.
By contrast, ETH’s rally has not yet encountered this exhaust valve. As of mid-August 2025, ETH ETFs had recorded inflows for 14 straight weeks, with the last 4 weeks’ total flows even exceeding BTC’s. No extended outflow signal has appeared to trigger a reversal. In historical analog, this suggests caution: if ETH inflows suddenly turn neutral or negative for several weeks, it could foreshadow a sharp pullback, as it did with BTC.
In summary, ETF flows act as a throttle on each rally. As long as large inflows persist, price momentum can continue; but history shows that multi-week flow reversals often signal that the top is at hand. Traders and treasury managers should watch these flow trends closely and prepare for scenario where the trend flips, as both assets have done in previous cycles.